FAST Graphs is a fundamental analysis software designed to help you see companies as businesses, not tickers. Focus on earnings, value, and long term performance. Visualize decades of financial data, connect price to business results, and make decisions grounded in fundamental stock analysis rather than speculation.

The Research Terminal brings together detailed views of growth, performance, valuation, and analyst accuracy. Each feature is built to help you interpret data with clarity and make informed, fact-based investing decisions.
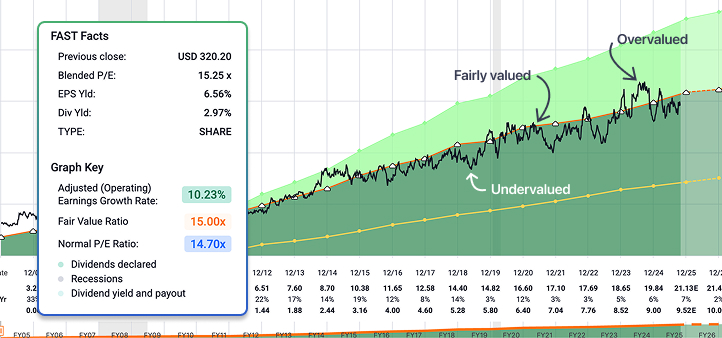
Intelligent investing is not about chasing trends or excitement. It is about understanding what you own. FAST Graphs shows how a company’s market price ultimately follows its earnings. By studying this relationship, you can recognize when a stock is undervalued or overvalued and invest with confidence, not emotion.
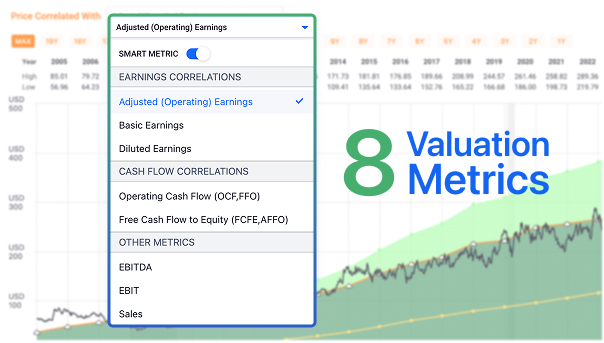
The orange valuation line represents a company’s fair value, grounded in fundamentals. FAST Graphs lets you visualize growth and consistency across nine valuation metrics, from Adjusted Earnings to Sales per Share. In seconds, you see not only what a company is worth but how strong its foundation truly is.
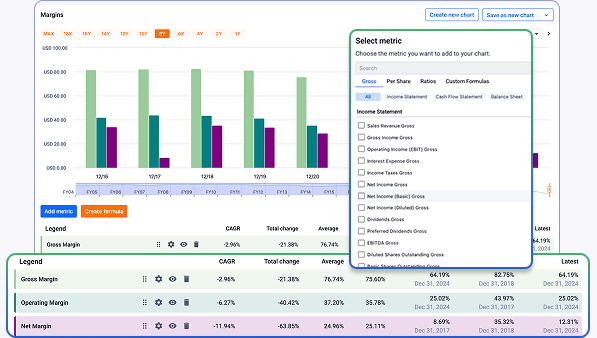
FAST Graphs offers a flexible charting system that lets you plot gross, per share, and ratio data on an annual or quarterly basis. You can also create custom formulas to uncover insights specific to your approach. Every chart is designed to help you think clearly about what truly matters.
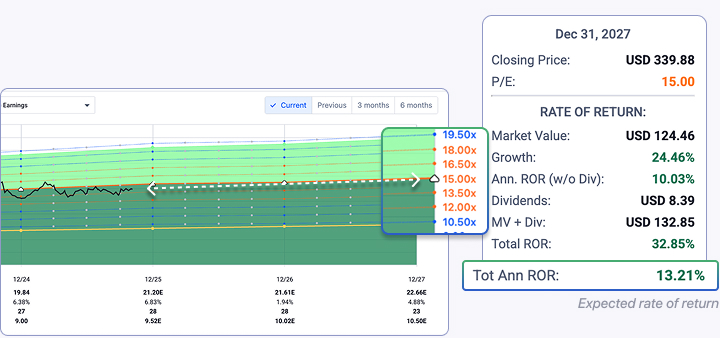
FAST Graphs uses analyst estimates to project future performance and fair value so you can evaluate opportunity through the lens of fundamentals. Compare these projections to historical averages to decide whether a company is trading at a fair price, a discount, or a premium. Investing with foresight begins with understanding value today.
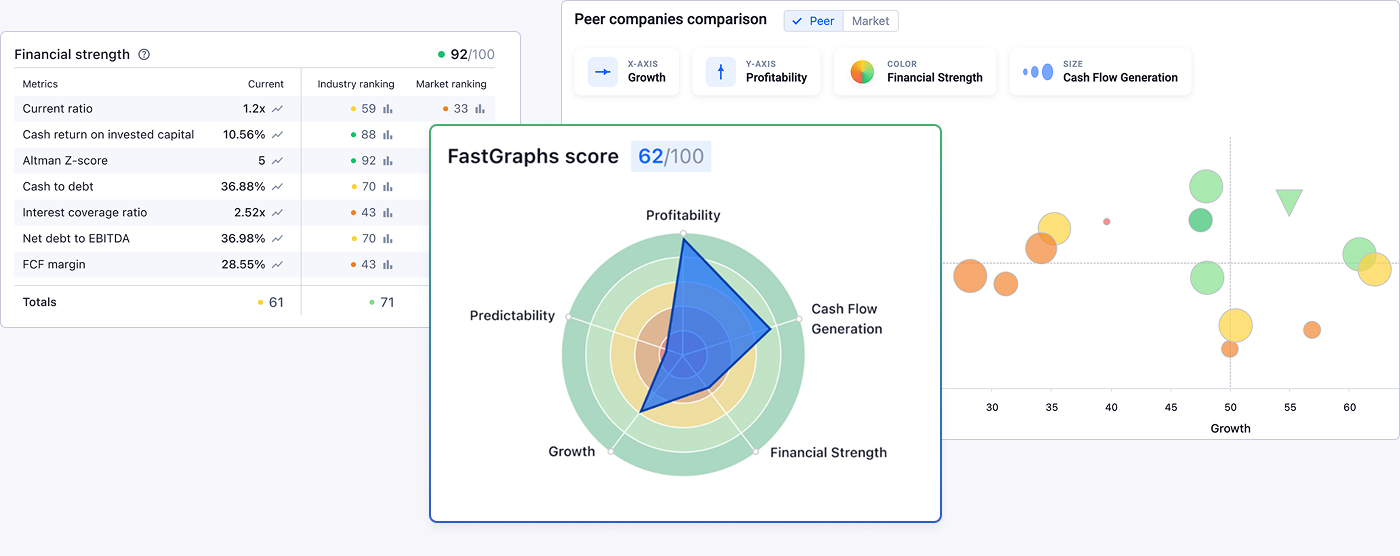
The FG Score™ distills a company’s most important financial fundamentals into a single, easy to understand score so you can quickly assess business quality without losing depth or transparency.
By organizing dozens of financial metrics into a structured, rules based framework, FG Score helps you focus on what matters most. Instead of sorting through pages of raw data, you can immediately see where a company is strong, where it may be weaker, and how balanced its overall financial profile really is.
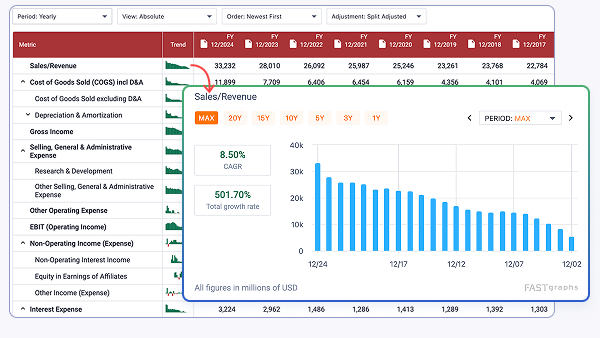
FAST Graphs provides up to 20 years of annual and quarterly financial statements. Each line item is visualized with clear charts and summaries of total change and compound growth. You gain a complete view of how a company’s fundamentals have evolved and what drives its long-term performance.
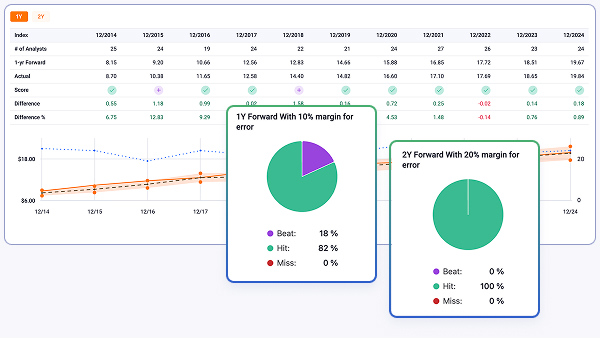
FAST Graphs measures how accurate analysts have been at forecasting a company’s growth using both one-year and two-year forward estimates. You can also see whether analysts are raising or lowering expectations over time. This helps you separate optimism from evidence and make decisions rooted in reliability.
With FAST Graphs, you gain access to innovative tools designed for value investors built on top of premiere, institutional-grade financial data.
Get startedFAST Graphs™ is a stock research tool that empowers subscribers to conduct fundamental stock research deeper and faster than ever before.