Monitor your holdings with the same clarity you use to research individual companies. The FAST Graphs portfolio tracker connects every position to its underlying fundamentals, helping you evaluate growth, income, and valuation through disciplined portfolio analysis rather than guesswork.
FAST Graphs transforms tracking into insight. View your holdings, analyze valuation and growth, and stay focused on fundamentals with a disciplined portfolio analyzer tool.
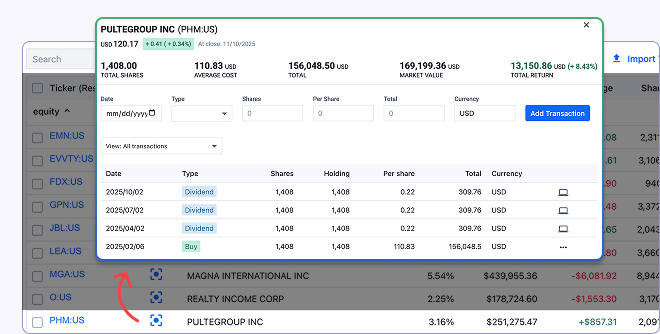
See every trade in context. Each buy and sell appears as a green or red dot directly on the Company and Security chart, helping you evaluate your decisions through valuation, not emotion.
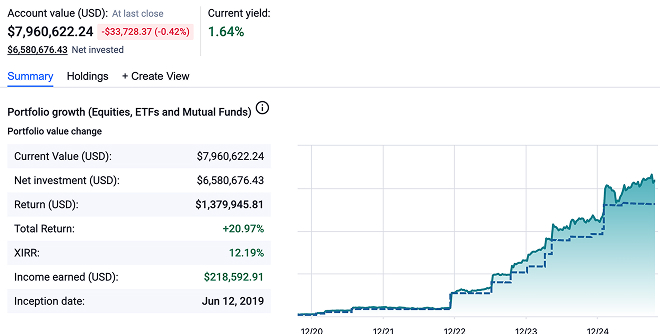
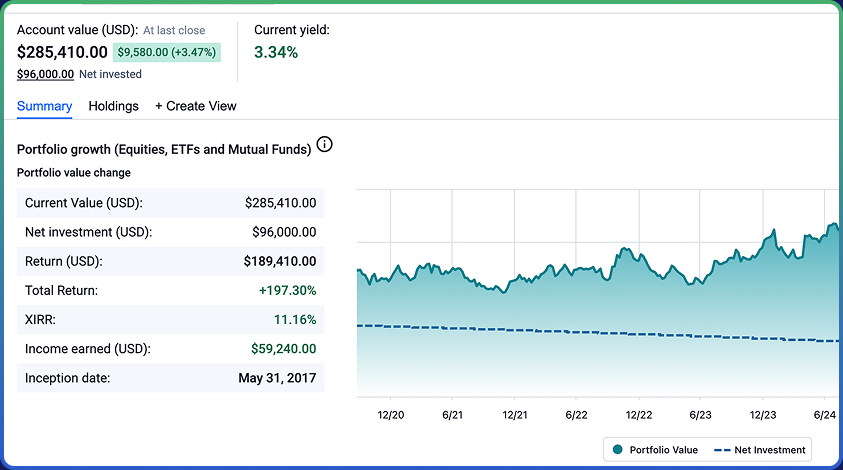
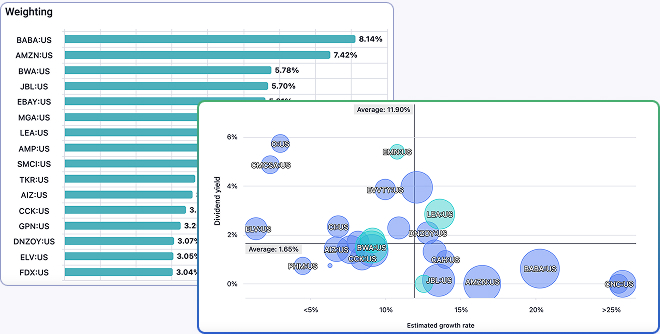
View your portfolio as a collection of businesses, not just stock prices. FAST Graphs calculates weighted averages for dividend yield and estimated earnings growth so you can perform real portfolio analysis based on fundamentals.
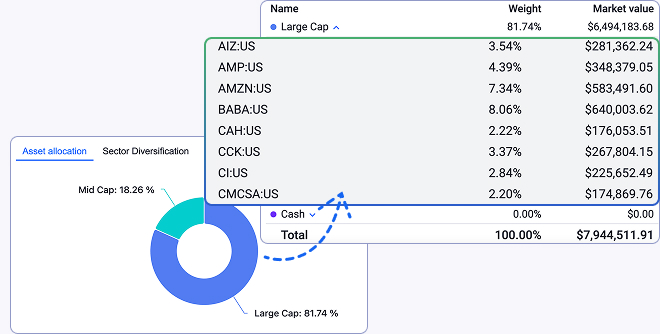
Analyze where your capital is working. FAST Graphs shows diversification by asset size, GICS sector, and individual position weighting through clear visual charts that reveal concentration and balance within your holdings.
Bring your data together effortlessly. Import holdings with a CSV file or connect directly to your brokerage account. FAST Graphs ensures your portfolio analysis tool stays up to date so you can focus on interpretation, not maintenance.
Whether you’re tracking potential ideas or managing a full portfolio, FAST Graphs helps you stay focused on fundamentals. Create watchlists to monitor companies or advanced portfolios to measure valuation, growth, and income with precision.
With FAST Graphs, you gain access to innovative tools designed for value investors built on top of premiere, institutional-grade financial data.
Get started
FAST Graphs™ is a stock research tool that empowers subscribers to conduct fundamental stock research deeper and faster than ever before.