Discover opportunities grounded in data, not hype. The FAST Graphs stock screener helps you filter, compare, and analyze companies using key fundamentals like earnings growth, valuation, and dividend strength. Build your watchlist with confidence through clear, fact-based screening.
FAST Graphs gives investors a simple way to search for quality. Use the stock screener to filter companies by earnings growth, valuation, financial strength, and focus on businesses where fundamentals support long term results.
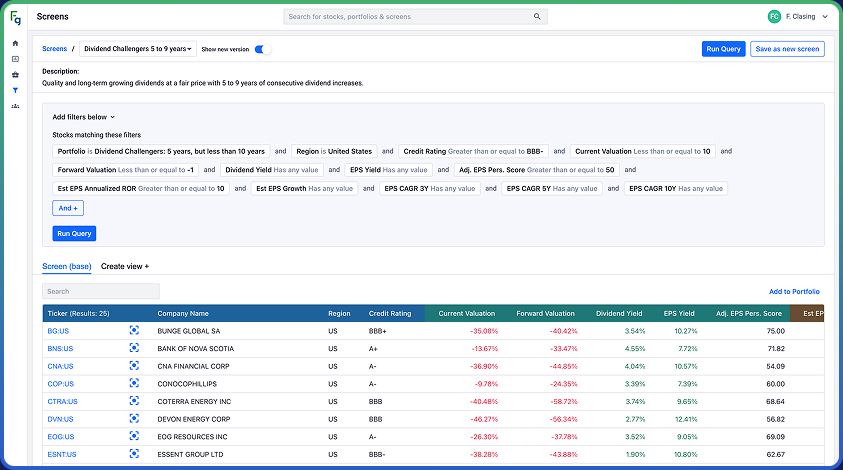
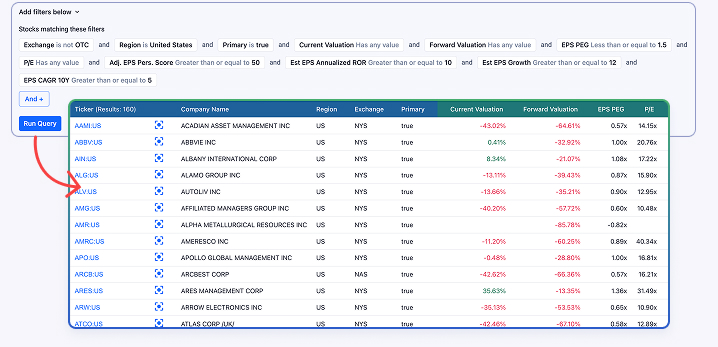
Filter thousands of companies by the metrics that matter most. The intuitive query builder makes it simple to combine valuation, growth, and profitability data into precise screens that reflect your investment discipline and highlight companies worth further study.
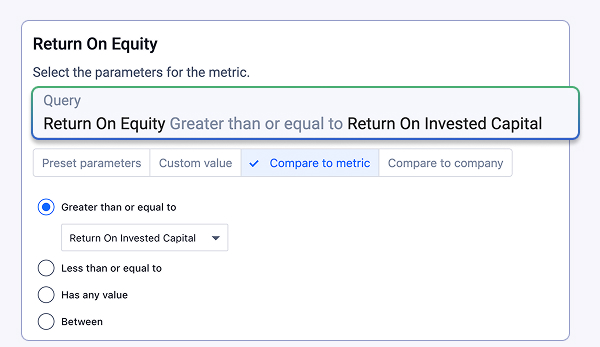
Go beyond fixed thresholds with a feature found nowhere else. FAST Graphs lets you compare metrics directly against each other. For example, filtering for companies where the current P/E is below the five-year average P/E or where ROE is greater than ROIC.
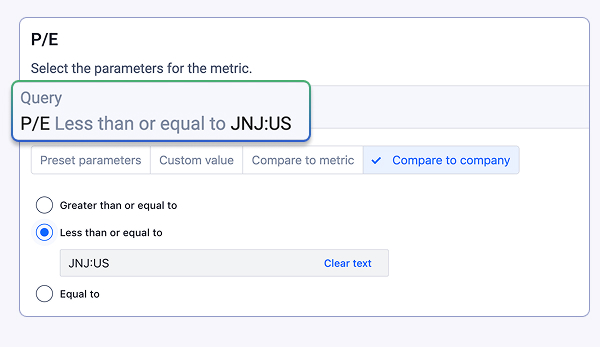
Find companies that resemble your favorites. Screen for businesses that match or exceed another company’s metrics — such as identifying stocks where P/E is lower than Johnson & Johnson’s or where growth and leverage are stronger.
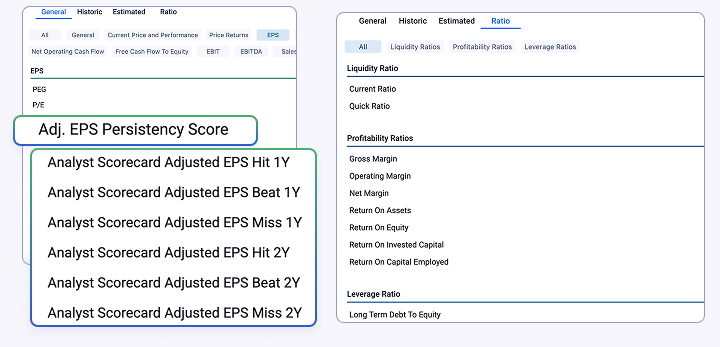
Evaluate companies using data only available on FAST Graphs, including Analyst Scorecard accuracy, Earnings Consistency Scores, and the FG Score — a complete measure of financial strength.
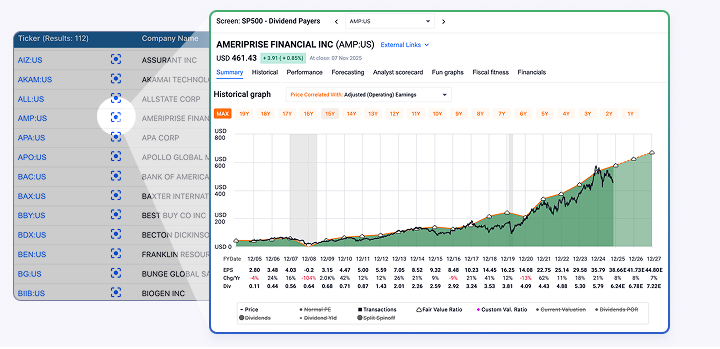
View results in a dynamic table with sortable columns and customizable layouts. Open any company in a snapshot or launch it directly in the Company and Security app to explore earnings history, valuation, and forecasts.
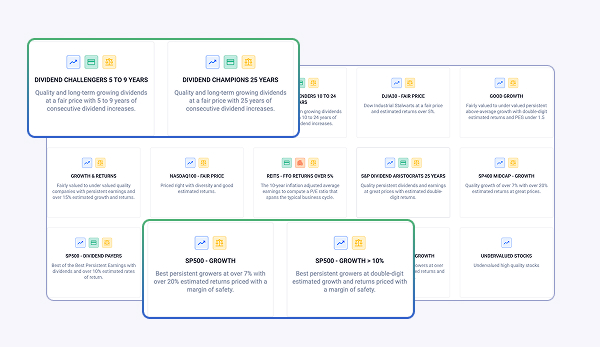
Start with ready-to-use screens built by the FAST Graphs team. These curated filters help you identify undervalued companies, consistent growers, and reliable dividend payers quickly and confidently.
With FAST Graphs, you gain access to innovative tools designed for value investors built on top of premiere, institutional-grade financial data.
Get started
FAST Graphs™ is a stock research tool that empowers subscribers to conduct fundamental stock research deeper and faster than ever before.