Vertical analysis is a powerful, investor-friendly tool that transforms financial statements into easy-to-compare percentages. When used with the right software—like theFundamentals Analyzer Software Tool (FAST Graphs)—it reveals a company’s true cost structure, profitability, and operational efficiency, making it indispensable for disciplined, valuation-focused investors.
Hello, fellow investors. Chuck Carnevalehere—also known as Mr. Valuation. Today, I want to walk you through one of the most practical yet underappreciated tools in our analytical toolkit: vertical analysis.
Over decades of focusing on fundamentals and valuation, I’ve learned that understanding the structure of a company’s financial statements is essential for making sound investment decisions. Withthe Fundamentals Analyzer (FAST Graphs), vertical analysis becomes not justaccessible, but truly transformative.
Let’s dive in and see how this method can sharpen your investment process.
Vertical analysis is a financial statement analysis technique where each line item is expressed as a percentage of a basefigure within the same period. In my experience using the FundamentalsAnalyzer, this approach—also referred to as common-size analysis—has proveninvaluable for cutting through the noise and focusing on what really matters.
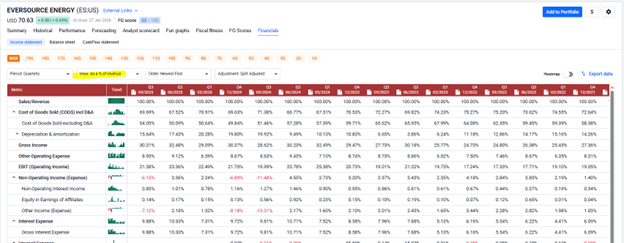
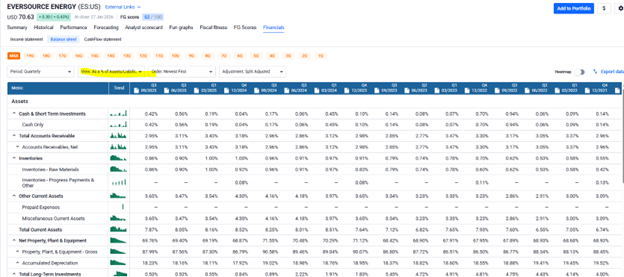
On the income statement, I express every line item as a percentage of total revenue. On the balance sheet, each item ispresented as a percentage of total assets. This standardization allows me toquickly assess the relative importance of each component, regardless of companysize.
As I often tell investors, vertical analysis transforms complex financial data into easily digestible insights that reveal a company’s true operational structure.
Let me show you exactly how I implement vertical analysis using the tools available in FAST Graphs. The process is straightforward, yet extremely powerful. Each line item on a financialstatement is converted into a percentage of a key base figure.
For income statements, every expense and profit line becomes a percentage of total sales. This immediately reveals how each dollar of revenue flows through the business—from costs, to operatingprofits, to the bottom line.
When analyzing a balance sheet through FASTGraphs, each asset, liability, and equity item is expressed as a percentage of total assets. This provides clear insight into capital allocation and overall financial structure.
The formula itself is simple:
(Line Item ÷ Base Amount) × 100
However, don’t let that simplicity fool you. Vertical analysis is exceptionally effective for spotting trends, comparing companies of different sizes, and benchmarking results against industry norms.
What I particularly appreciate about vertical analysis in FAST Graphs is how it simplifies decision-making. Ratherthan getting lost in absolute numbers, I can immediately see the proportional relationships that drive business performance. Over time, this approach has helped me identify both opportunities and red flags that might otherwise remainhidden.
Let me share a practical hypothetical example that illustrates the value of vertical analysis.
While analyzing a company using FASTGraphs, I reviewed an income statement showing $5,000,000 in total sales. Cost of goods sold (COGS) came in at $1,000,000, or 20% of sales, immediately providing insight into the company’s gross margin efficiency.
General and administrative expenses totaled$2,000,000, representing 40% of sales. That figure naturally raised questions about cost control. Most importantly, net income of $1,500,000 translated intoa strong 30% net profit margin.
In just moments, vertical analysis allowed me to see how efficiently management was converting revenue into profits.
On the balance sheet, with total assets of$515,000, cash of $125,000 represented 24.2% of assets. Accounts receivable of$90,000 accounted for 17.5%, while inventory of $150,000 comprised 29.1%.
These percentages quickly revealed the company’s asset allocation strategy and working capital management, insightsthat would have taken much longer to uncover from raw dollar figures alone.
Through many years of using FAST Graphs,I’ve identified several metrics that deserve special attention when performing vertical analysis:
Within FAST Graphs, I can quickly benchmark these vertical analysis metrics against industry peers and long-term historical performance, making the analysis far more actionable.
No analytical tool is perfect, and vertical analysis is no exception. I believe it’s important to be transparent about both its strengths and limitations.
Pros
Cons
For these reasons, I always use verticalanalysis alongside other analytical methods. It is most effective when combinedwith horizontal analysis and sound valuation principles.
As I’ve demonstrated throughout my career—and in countless analyses using FAST Graphs, vertical analysis is apowerful tool that transforms financial statements into investor-friendly percentages. It enhances comparability, highlights critical cost structures,and supports better-informed decision-making.
That said, successful investing requires patience and a comprehensive analytical framework. Vertical analysis should bepart of your toolkit, not your entire strategy. When combined with horizontalanalysis, valuation metrics, and the visual power of FAST Graphs, it becomes anindispensable component of disciplined fundamental analysis.
As always, forecasting requires continuous monitoring and adjustment. Fortunately, with the right tools and the right mindset, you’re well equipped for the journey.
What is the main difference between vertical and horizontal analysis?
Vertical analysis expresses each line item as a percentage of a base figure within a single period, emphasizing proportional relationships. Horizontalanalysis compares financial data across multiple periods to identify trendsover time. I use both within the Fundamentals Analyzer for a completeperspective.
Why is vertical analysis important for investors?
Vertical analysis allows investors to quickly assess cost structure, profitability, and resource allocation. In my experience, it revealsoperational efficiency patterns that absolute numbers alone often obscure.
Can vertical analysis be used for both income statements and balance sheets?
Absolutely. On income statements, items are expressed as percentages of total revenue. On balance sheets, they’re expressed as percentages of total assets. Each provides valuable insight into different aspects of financial health.
What are common benchmarks used in vertical analysis?
Industry averages for gross margin, operating margin, net profit margin, and asset allocation ratios are commonly used benchmarks. FAST Graphs makes thesecomparisons fast and intuitive.
How does vertical analysis complement horizontal analysis?
Vertical analysis provides a structural snapshot of a company’s financials at a single point in time, while horizontal analysis highlights trends acrossperiods. Used together, they offer a more complete understanding of bothposition and direction.
Vertical analysis—especially when powered by tools like FAST Graphs—is an essential technique for serious investors. It brings clarity, comparability, and actionable insight to financial statements, helping you make more informed investment decisions grounded in fundamentals and valuation.
FAST Graphs™ is a stock research tool that empowers subscribers to conduct fundamental stock research deeper and faster than ever before.