Back to Blog
October 31, 2025

Stock Valuation Matters - And It Matters a Lot

What Is Stock Valuation

By Chuck Carnevale, co-founder of FAST Graphs (“Mr. Valuation”)

Stock valuation answers a deceptively simple question: What is a business truly worth? Price is what you pay; value is what you get. In this talk, Chuck shows how to anchor investment decisions in fundamentals—so you’re not guessing based on headlines or momentum, but weighing a company’s real earning power against the market’s mood.

The Orange Line: Intrinsic Value at a Glance

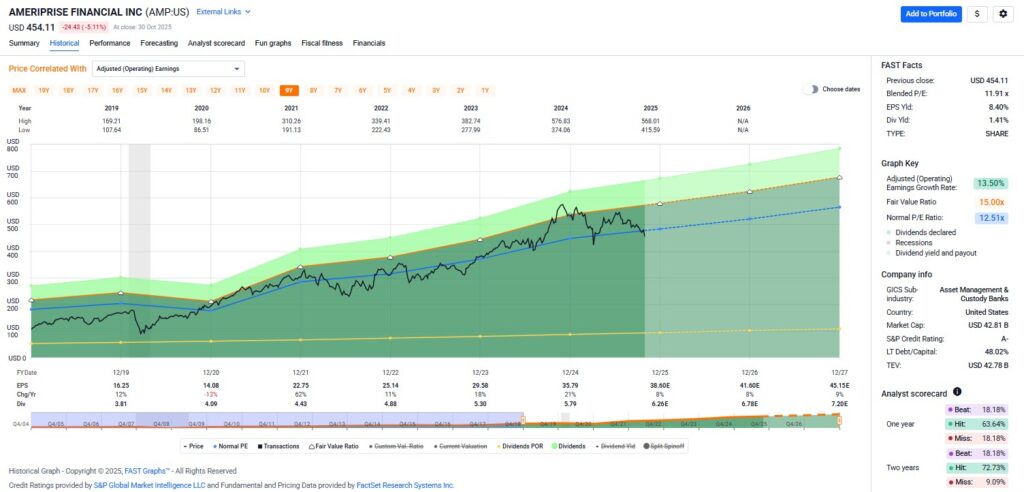
In FAST Graphs, stock valuation – the orange line represents intrinsic value. It’s built from several time-tested methods so investors can quickly see when price sits below value (potential opportunity) or above value (heightened risk). That visual—price vs. value—turns a noisy chart into a disciplined framework.

Core Valuation Methods Used

  • Earnings Yield / P/E Insight
    Many investors stare at P/E. Chuck prefers its inverse, the earnings yield. It frames valuation as a cash-on-cash return conceptually similar to a yield: what the company’s earnings generate relative to the price you pay.
  • Discounted Cash Flow (DCF)
    FAST Graphs incorporates DCF by using a hurdle informed by a long-term fair-value anchor (think 6–7% earnings yield, the inverse of a 15x P/E). The spirit: if a business can compound at or above that bar, it’s creating adequate value for shareholders.
  • Ben Graham’s Intrinsic Value Formula (Low Growth)
    For companies growing below 5%, FAST Graphs applies a purer Graham model to draw the intrinsic value line. Example: a slow-growing staple like Campbell Soup often values near a 13x P/E under this lens.
  • Growth-Aligned Multiples (Peter Lynch-style ranges)
    For faster growers, valuation references align more closely with growth rates, but are still grounded in fundamentals rather than sentiment.

Price Follows Business Over Time

Short-term, markets vote; long-term, they weigh. Chuck demonstrates the linkage with multiple companies:

  • Ameriprise (AMP): A clear view of when price dips below the orange line (bargain) and when it rises above (premium).
  • FedEx (FDX) & Cummins (CMI): Cyclicals where earnings swings drive price swings. Buying near or below fair value materially improves long-term returns; paying too much raises risk even if you still “make money.”
  • Meta (META): Early hyper-growth supported high multiples, but as growth normalizes, valuation discipline matters more; rich multiples can make stocks vulnerable to disappointments.
  • Apple (AAPL): Over long windows Apple outperforms, yet in more recent periods performance converges with—or even trails—the market as growth slows and multiples stretch.
  • Pfizer (PFE): A cautionary tale: premium valuations without matching fundamentals can precede deep drawdowns.
  • NVIDIA (NVDA) & Oracle (ORCL): Explosive narratives (AI) can push multiples far above historical anchors. Strong businesses can still be poor buys at the wrong price.
stock valuation

Why Valuation Discipline Changes Outcomes

Two identical products—one at $10, the other at $20—which do you pick? In markets, the products (businesses) evolve and prices swing constantly; valuation keeps you oriented. Chuck shows that waiting for fair value can nearly double prospective return versus buying at a premium. Even great companies become mediocre investments if purchased too dear.

Key implications:

  • Undervaluation boosts potential returns and lowers downside risk.
  • Overvaluation can still make money during a bull run but amplifies drawdown risk and often reduces risk-adjusted returns.
  • Fair value is a sensible baseline for compounding with confidence.

Sentiment vs. Fundamentals

Sentiment can swamp fundamentals in the short run on stock valuation—earning seasons, macro shocks, and hype cycles all move prices. But fundamentals assert themselves over time. FAST Graphs helps you separate the emotional “voting” from the rational “weighing” by keeping intrinsic value front and center.

How to Apply This in Practice

  1. Start with the business, not the ticker. Look at earnings power, growth durability, cash flows, balance sheet quality, and risks.
  2. Use multiple valuation references. Cross-check DCF, earnings yield/P-E ranges, and Graham-style anchors for slower growers.
  3. Compare price to intrinsic value. Is price below (margin of safety), near (fair), or above (premium) the orange line?
  4. Forecast with humility. Analyst estimates can guide expectations, but valuation discipline is your risk control.
  5. Decide with intent. If buying a premium narrative, understand you’re accepting higher volatility and drawdown risk; size positions and time horizons accordingly.

FAST Graphs Analyze Out Loud Video

The Takeaway

Valuation is both art and science—quantitative models informed by qualitative judgment. By anchoring decisions to intrinsic value, you transform speculation into investing: buying businesses for less than they’re worth, holding while fundamentals compound, and resisting the crowd when prices detach from reality. Markets will always have moods. Value endures.

If you found this helpful, explore FAST Graphs to see the orange line—intrinsic value—on 80,000+ symbols and bring valuation discipline to every idea you consider.

Try FAST Graphs for FREE Today!

SUBSCRIBE to our YouTube Channel

Click here for our Research Articles

Disclosure: Long AMP, FDX, CMI, META, PFG, AAPL, FI, NVDA, DOX, ORCL

Disclaimer: The opinions in this document are for informational and educational purposes only and should not be construed as a recommendation to buy or sell the stocks mentioned or to solicit transactions or clients. Past performance of the companies discussed may not continue and the companies may not achieve the earnings growth as predicted. The information in this document is believed to be accurate, but under no circumstances should a person act upon the information contained within. We do not recommend that anyone act upon any investment information without first consulting an investment advisor as to the suitability of such investments for his specific situation.

FAST Graphs™ is a stock research tool that empowers subscribers to conduct fundamental stock research deeper and faster than ever before.