by Chuck Carnevale
The cornerstone of successful investing is understanding how do you analyze stocks—and nothing brings clarity to this process like a disciplined, fundamentals-driven approach. FAST Graphs, my research tool of choice, empowers investors to visualize the relationship between a company’s earnings, valuation, and price, making stock analysis both accessible and actionable.
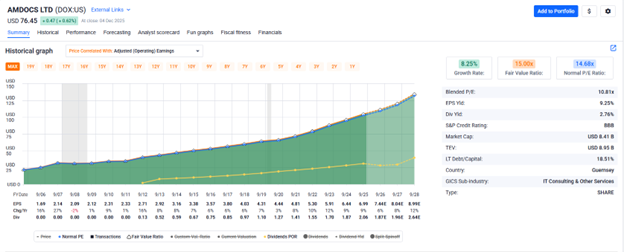
The growth of the business without stock prices:
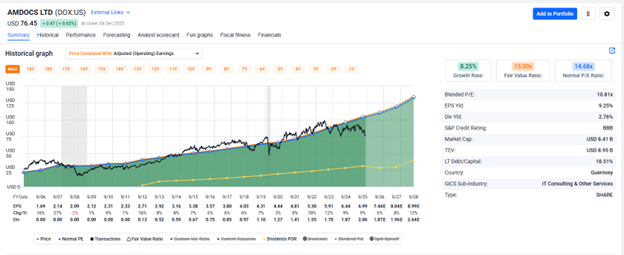
Stock prices go where the earnings go in the long run:
Stock analysis is the process of evaluating a company’s financial health, business prospects, and market environment to determine whether its stock is a sound investment. This answers the question: how do you evaluate a stock and decide if it’s worth your capital.
Effective stock analysis combines:
By learning how to analyze stocks, investors can distinguish between companies that are truly growing and those whose stock prices are temporarily inflated by market sentiment.
To truly grasp how to analyze stocks, investors must understand the difference between fundamental analysis and technical analysis—and why fundamentals should always take priority.
Fundamental analysis examines a company’s financial statements, business model, and competitive position to estimate intrinsic value. By focusing on earnings, cash flow, and growth, investors answer the key question: how do you evaluate a stock for long-term potential. Fundamentals matter—and they matter a lot.
Technical analysis studies price charts, trading volumes, and indicators to forecast short-term price movements. While it can sometimes provide insight, it is inherently unpredictable. Short-term price movements rarely reflect the company’s true value.
The Bigger Picture
Stock analysis is about understanding the story behind the numbers. By learning how to do stock analysis through fundamentals, investors can focus on companies that are genuinely growing rather than chasing temporary market trends.
Fundamental analysis is the foundation of intelligent investing. It answers the question: how do you do stock analysis for the long term? By reviewing earnings, cash flows, assets, and liabilities, investors can estimate a company’s true worth and make informed decisions.
Focusing on intrinsic value rather than daily price movements is key. Stock prices fluctuate, but they ultimately follow the company’s earnings. Understanding this relationship is central to how to evaluate a stock.
Using FAST Graphs for Fundamental Analysis
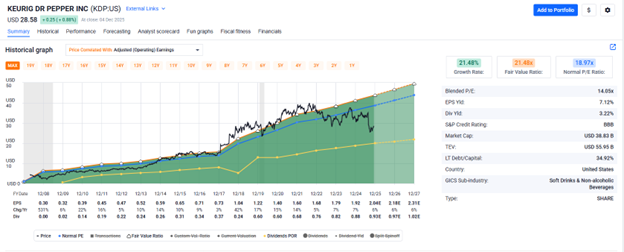
When the market undervalues the business (the price will be below the orange and blue lines):
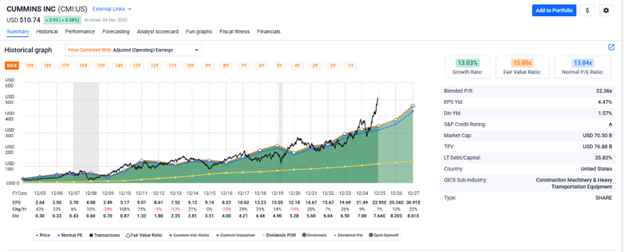
When the market overvalues the business (the price will be above the orange and blue lines):
FAST Graphs visually connects fundamentals to stock price, making how do you analyze stocks straightforward and actionable.
Ratios are the language of fundamental analysis, helping investors answer how do you evaluate a stock efficiently.
Key Ratios:
FAST Graphs makes ratios instantly visible, helping investors quickly determine how to do stock analysis and identify whether a stock is undervalued or overvalued, at a glance.
No company exists in a vacuum. Comparative analysis benchmarks a company’s performance against peers and industry averages, answering how do you evaluate a stock in context.
FAST Graphs allows investors to overlay multiple companies’ data, visually revealing which are outperforming or lagging in growth, profitability, or valuation.
Key considerations:
While fundamental analysis tells you what to buy, technical analysis claims to help decide when to buy. It examines price charts, volumes, and indicators like moving averages or RSI.
Limitations:
Tools like FAST Graphs prioritize fundamentals, showing investors how to do stock analysis without being distracted by market noise.
A step-by-step approach is essential for effective stock analysis. Here’s my framework for how do you analyze stocks:
Step 1: Get to Know Your Research Tools
Use FAST Graphs, stock screeners, news aggregators, and portfolio trackers. The right tools save time and sharpen your focus.
Step 2: Gather Your Stock Research Materials
Collect annual reports, SEC filings, analyst notes, and industry data. FAST Graphs centralizes much of this data, but always review primary filings to fully understand how to evaluate a stock.
Step 3: Narrow Your Focus
Zero in on key metrics: earnings growth, valuation ratios, dividend history, and competitive positioning. Screen by sector, size, or valuation. FAST Graphs highlights trends for easier stock analysis.
Step 4: Turn to Qualitative Stock Research
Numbers tell part of the story. Assess management quality, brand strength, and strategic vision. Read conference call transcripts and study leadership backgrounds to answer how to do stock analysis comprehensively.
Step 5: Put Your Stock Research into Context
Compare your findings to peers and market trends. FAST Graphs makes this seamless, helping investors see both absolute value and relative performance when evaluating how to analyze stocks.
Stock market success is built on disciplined research and a strong understanding of how do you analyze stocks. Tools like FAST Graphs visually connect earnings, valuation, and price, making how to do stock analysis accessible and actionable.
Focus on fundamentals, ignore short-term noise, and let valuation guide your decisions. By mastering how to evaluate a stock through disciplined research and visual tools, investors gain confidence in their long-term decisions.
Which Stock Analysis Technique Is Best?
Combine fundamental analysis, qualitative insights, and comparative benchmarking to answer how to analyze stocks effectively.
How Do You Know If a Stock’s Price Will Go Up?
No method guarantees price movement, but FAST Graphs shows if a stock is undervalued or overvalued, helping guide decisions.
Is “Due Diligence” the Same as Researching Stocks?
Yes. Due diligence is the detailed process of reviewing financials, management, and risks—essentially how to evaluate a stock thoroughly.
How Do I Research Stocks Before Buying Them?
Gather filings, reports, and analyze ratios. Compare with peers and qualitative factors. FAST Graphs streamlines this process for effective stock analysis.
How Can Beginners Start Analyzing Stocks?
Start with public information, learn key ratios, practice paper trading, and gradually incorporate comparative analysis. This builds the foundation for how to do stock analysis.
FAST Graphs™ is a stock research tool that empowers subscribers to conduct fundamental stock research deeper and faster than ever before.