by Chuck Carnevale
Understanding how to find the intrinsic value of a stock is the cornerstone of sound, long-term investing. By focusing on fundamentals and using proven valuation models, investors can cut through market noise and make rational, data-driven decisions. Using an intrinsic value calculator free online or a stock intrinsic value calculator can simplify this process and help you invest confidently.
“Price is what you pay; value is what you get.” This timeless wisdom, echoed by Warren Buffett and championed by value investors like Chuck Carnevale (Mr. Valuation), lies at the heart of successful investing. The market’s daily price swings are often driven by emotion, speculation, and short-term news. But the intrinsic value of a business, its true worth based on fundamentals, remains anchored in reality.
In this article, we’ll demystify the concept of intrinsic value, walk through the most reliable models for calculating it, and show you how to use an intrinsic value calculator. Whether you’re a beginner or a seasoned investor, mastering these tools will help you find intrinsic value of a stock and invest with confidence.
There’s no single “right” answer when determining what a business is truly worth. Investors rely on a toolkit of models, each with its own strengths. Let’s break down the most widely used approaches, just as Mr. Valuation would, with clarity, discipline, and a focus on fundamentals.
The Gold Standard for Intrinsic Value
The Discounted Cash Flow (DCF) model is the bedrock of modern valuation. It asks a simple but profound question: How much are all the future cash flows of this business worth in today’s dollars? By projecting a company’s free cash flows and discounting them back to the present using a rate that reflects risk, you arrive at an estimate of intrinsic value.
DCF Formula (Intrinsic Value Formula):
Intrinsic Value = CF₁/(1+r)¹ + CF₂/(1+r)² + … + CFₙ/(1+r)ⁿ
Where:
CFₜ = Cash flow in year t
r = Discount rate (often the company’s weighted average cost of capital)
n = Number of forecast years
Forecast Johnson & Johnson’s free cash flow for the next 5-10 years.
Year Projected FCF per share:
2026 9.57
2027 10.36
2028 11.21
2029 12.14
2030 13.14
Estimate a terminal value for cash flows beyond the forecast period.
Discount all cash flows and the terminal value back to present value.
Sum the present values to find the intrinsic value per share.
Summary Table
Component Value ($B) % of Total Value
PV of 2026–2030 FCFs 45.77 14.2%
PV of Terminal Value 277.04 85.8%
Total Enterprise Value 322.82 100%
Shares Outstanding 2.407
Intrinsic Value/Share $134.13
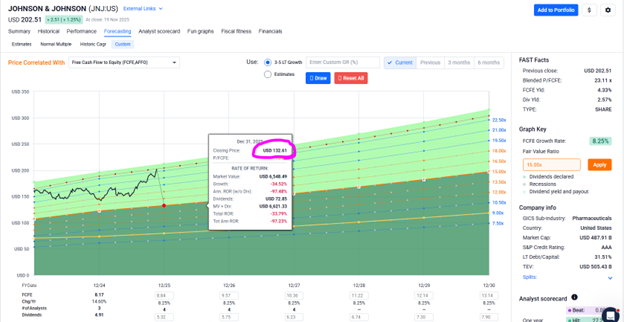
FAST Graphs utilizing a modified version of DCF calculations
Note that using the academic version versus the FAST Graphs simply point-and-click option provides very similar results. FAST Graphs’ intrinsic value number is $132.61 versus $134.13, virtually the same. Remember, the intrinsic value calculation is precise but not perfect.
Why Use DCF?
Pro Tip:
Always use conservative assumptions for growth and discount rates to build in a margin of safety.
FAST Graphs modified dividend cash flow calculations
The fundamentals analyzer software tool FAST Graphs incorporates and utilizes a modified version of the academic discounted cash flow calculation. The primary adjustment is that FAST Graphs discounts adjusted operating earnings in lieu of cash flow. Additionally, FAST Graphs utilizes a discount rate based on Ben Graham’s recommendation to never pay a P/E ratio over 15 for most companies.
Tailor-made for companies with stable, predictable dividends. It values a stock as the present value of all expected future dividends.
Types of DDM:
Why Use DDM?
A Special Case of DDM for Consistent Dividend Growers
The Gordon Growth Model (GGM) is a streamlined version of the DDM, assuming dividends grow at a constant rate forever.
GGM Formula:
Intrinsic Value = D₁ / (r – g)
Where:
D₁ = Next year’s expected dividend
r = Required rate of return
g = Dividend growth rate
Why Use GGM?
For companies with irregular dividends or asset-heavy businesses.
Intrinsic Value = Book Value + Σ [Residual Incomeₜ / (1 + r)ᵗ]
Where:
Residual Incomeₜ = Net Incomeₜ – (r × Book Valueₜ₋₁)
r = Cost of equity
Step-by-Step Example:
Calculate current book value per share.
Forecast net income and book value for each period.
Compute residual income for each year.
Discount residual incomes to present value and add to book value.
Why Use Residual Income Models?
Useful for banks, insurance companies, and firms with unpredictable dividends.
Focuses on value creation above the cost of capital.
Key Finding:
No single model is perfect. The best investors use multiple approaches, compare results, and always anchor their analysis in the business’s fundamentals.
Why Use Residual Income Models?
Intrinsic value is the North Star for rational investors. By focusing on what a business is truly worth, rather than what the market is willing to pay, you gain a powerful edge. This is where margin of safety comes into play—a principle championed by Ben Graham, Warren Buffett, and Chuck Carnevale.
Margin of Safety Defined:
It’s the buffer between a stock’s intrinsic value and its market price. For example, if a stock’s intrinsic value is $60, but it’s trading at $40, you have a $20 margin of safety.
Why It Matters:
While DCF and DDM are the gold standards, investors often use a variety of relative valuation metrics to cross-check their analysis. Here are the most common:
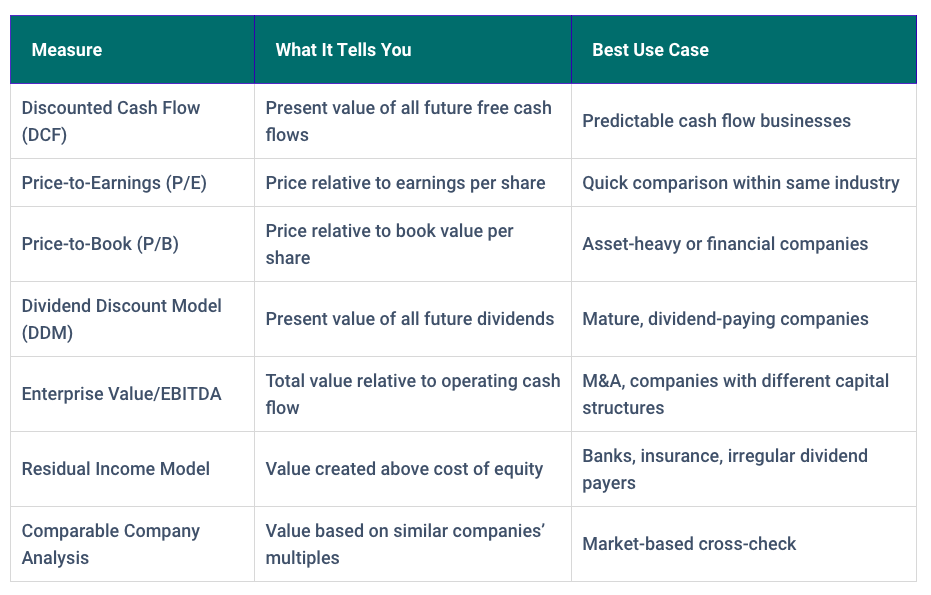
How to Use These Measures:
Sound investing is about understanding value, not chasing price. By mastering the intrinsic value formula and using an intrinsic value calculator free online, you empower yourself to make rational, disciplined decisions. Remember: the market is a voting machine in the short run, but a weighing machine in the long run. Focus on the business behind the stock, and let intrinsic value be your guide. FAST Graphs simplifies this by providing a clear comparison between intrinsic value and market price.
What Factors Can Cause a Company's Intrinsic Value to Change Over Time?
A company’s intrinsic value can change due to shifts in earnings, cash flow projections, growth rates, risk profile, or capital structure. New products, management changes, or macroeconomic trends can all impact intrinsic value.
What's the Difference Between Market Value and Intrinsic Value?
Market value is the current trading price, driven by supply and demand. Intrinsic value is your estimate of what the business is truly worth based on fundamentals.
Is Intrinsic Value Better Than Market Value for Investing?
Intrinsic value provides a rational, objective basis for investment decisions, while market value reflects current sentiment. The best investors use both—buy when market value is below intrinsic value.
Why Is It Useful to Know Intrinsic Value?
Knowing intrinsic value helps identify undervalued or overvalued stocks, avoid emotional decisions, and invest with a margin of safety. Tools like a stock intrinsic value calculator make this easier.
The path to investment success is paved with discipline, patience, and a relentless focus on intrinsic value. By investing in a stock at its intrinsic value, you participate fully in the business’s growth. Buy below intrinsic value, and you earn more than the company grows at. Buy above intrinsic value, and returns may lag. Tools like FAST Graphs and an intrinsic value calculator help ensure disciplined, value-focused investment decisions.
FAST Graphs™ is a stock research tool that empowers subscribers to conduct fundamental stock research deeper and faster than ever before.