By Chuck Carnevale, “Mr. Valuation”
As someone who has spent decades analyzing stocks and developing the FAST Graphs Fundamentals Analyzer Software Tool, I can tell you that understanding how to determine what a stock is worth is the cornerstone of intelligent investing. The market is full of noise, opinions, and emotions, but at its core, a stock’s true worth—its intrinsic value—comes from the business behind the ticker symbol.
When investors ask me how to find the value of a stock or how to find fair value of a stock, my answer is always the same: focus on fundamentals. Earnings, cash flows, and dividends are the primary drivers of long-term shareholder returns. By evaluating these fundamentals and comparing them to the current market price, we can determine whether a stock is undervalued, fairly valued, or overvalued.
This process is not about predicting the future or timing the market. Instead, it is about placing today’s prices into proper perspective using sound valuation principles. That discipline forms the foundation of learning how to analyze a stock before buying and is essential for long-term investment success.
When I analyze a company for investment,I rely on several time-tested valuation ratios that help investors understand what they are paying for a business. These metrics form the foundation for investors learning how to find the fair value of a stock and how to analyze a company for investment based on measurable financial performance.
Key valuation ratios include:
Viewed in the context of historical valuation ranges and industry peers, these metrics help investors evaluate companies for investing and avoid overpaying for growth that may never materialize. This is a critical step in learning how to analyze stocks for beginners, as well as for seasoned investors seeking valuation discipline.
With the FAST Graphs Fundamentals Analyzer,I can visualize the long-term relationship between a company’s earnings, dividends, and stock price. This allows investors to immediately see whether a stock is trading above, below, or near its intrinsic value.
By plotting both historical and estimated future earnings, the tool helps determine whether the current price offers a margin of safety or whether the stock is priced for perfection. This fundamentals-based approach removes emotion from the process and provides a disciplined framework for investors who want to understand how to analyze a stock before buying, rather than reacting to short-term market movements.
On FAST Graphs, the orange line represents intrinsic value, or the fair valuation reference line. When stock prices deviate significantly from that line, investors gain valuable insight into valuation extremes and potential opportunity or risk.
Examples include:
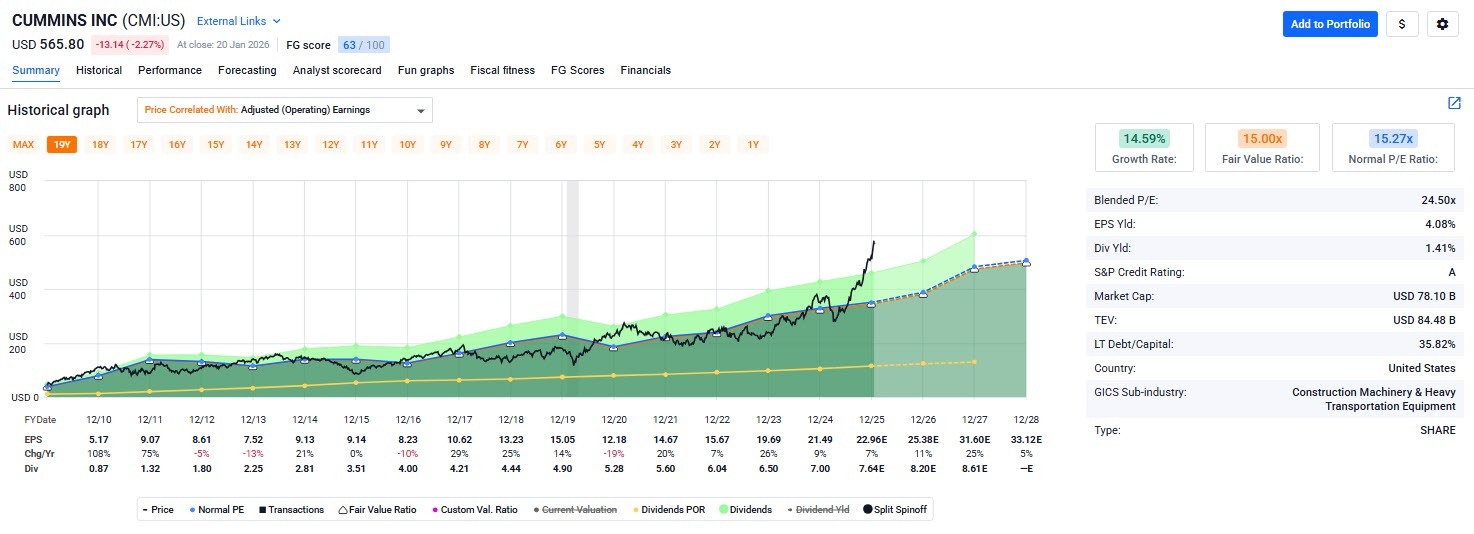
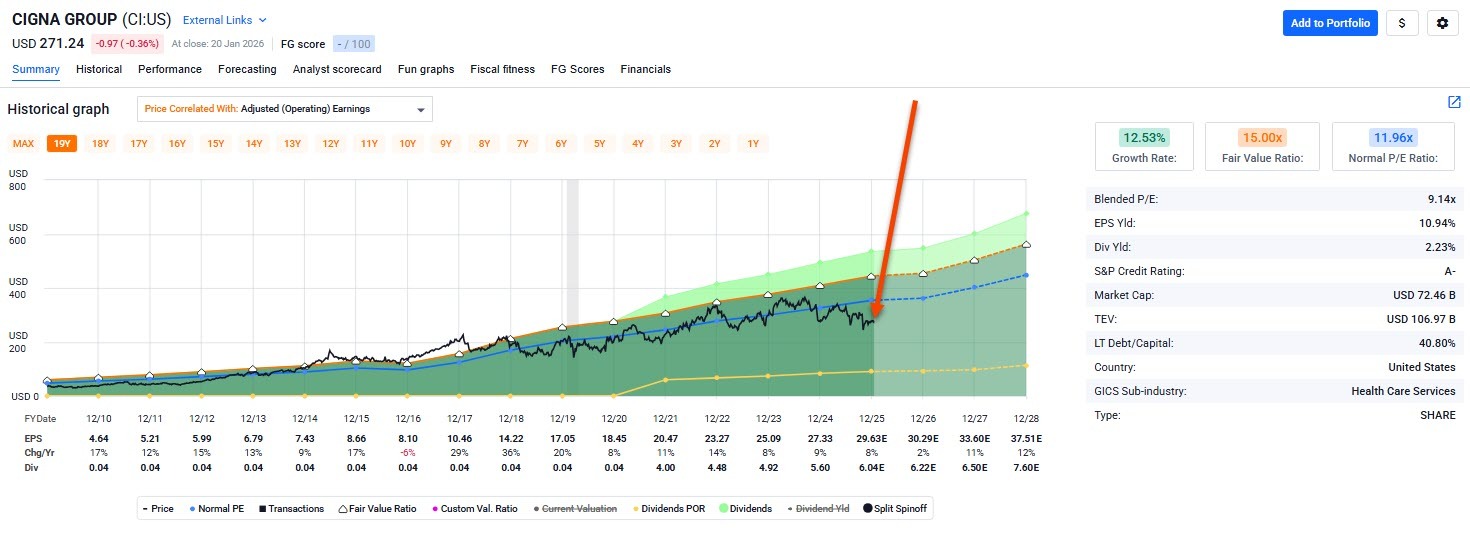
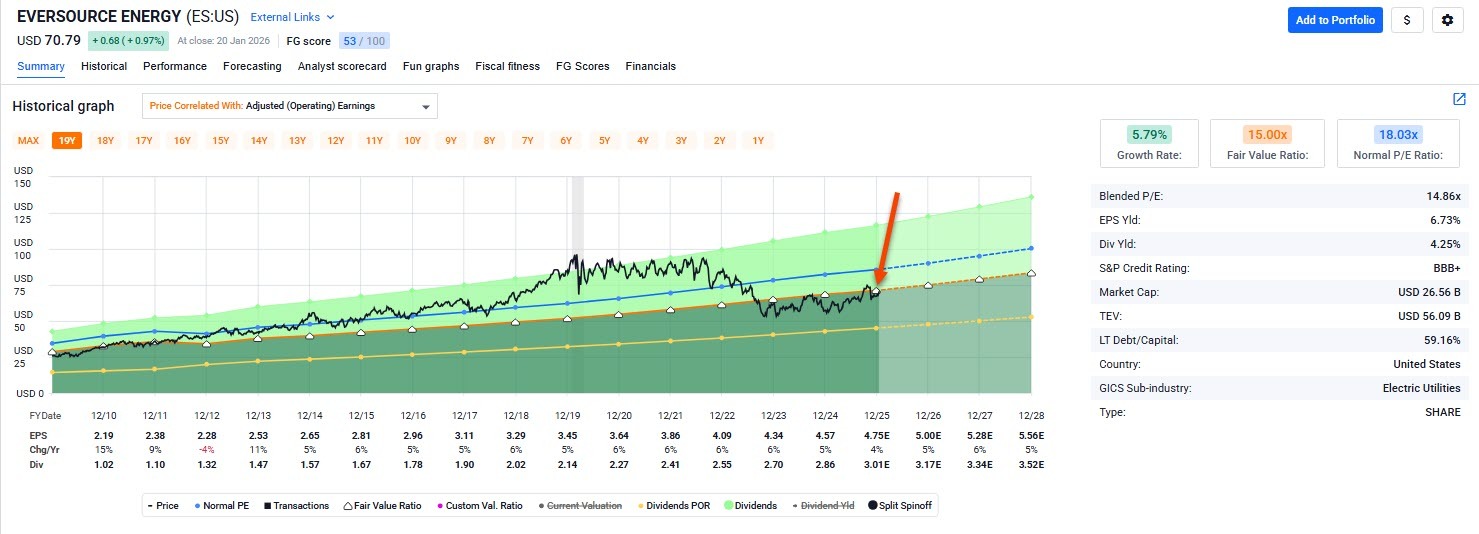
This visual framework helps investors at all experience levels better understand how to analyze the stock market through the lens of business fundamentals rather than price speculation.
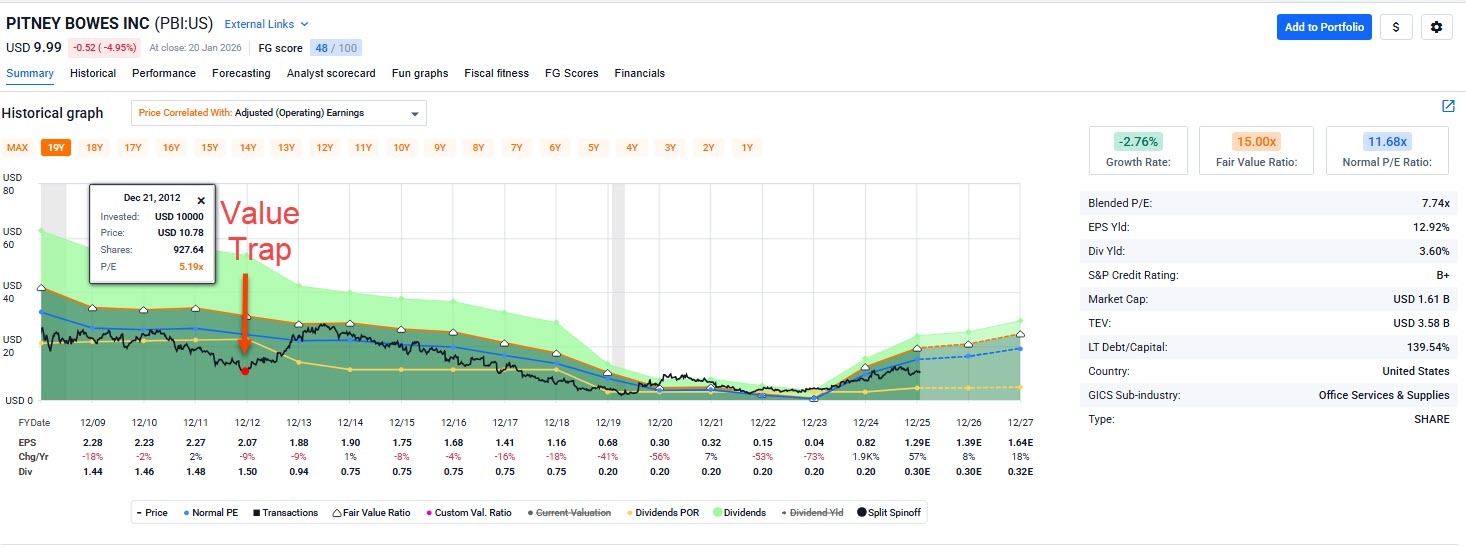
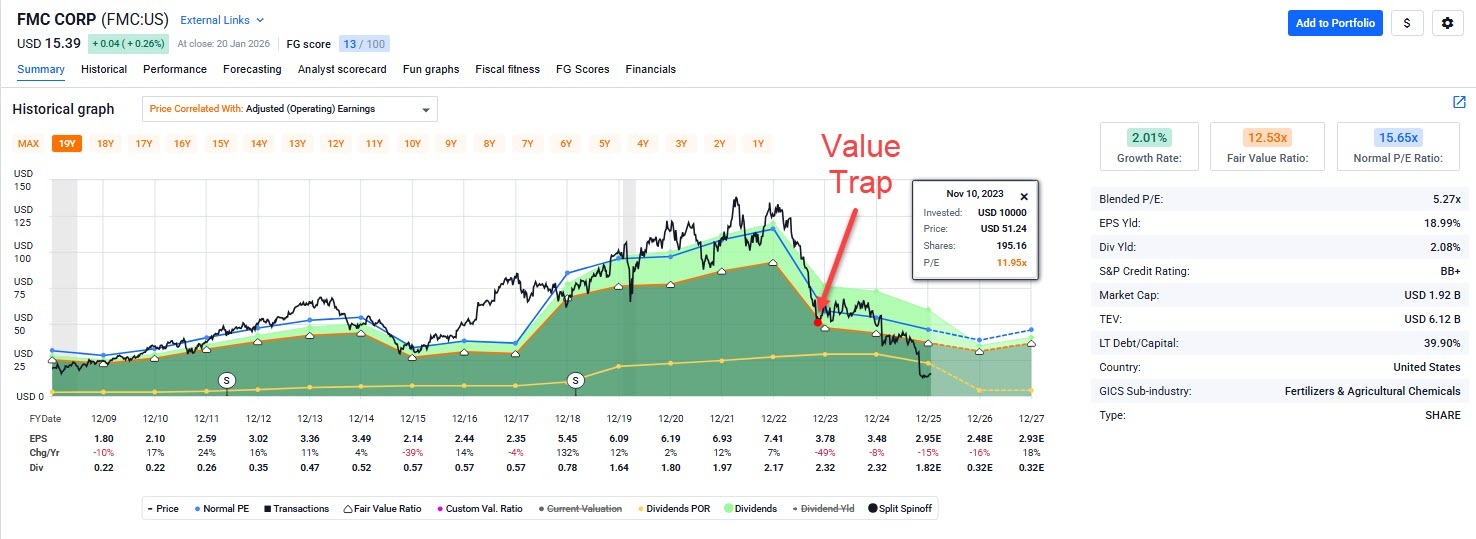
It is important to remember that not every stock trading at a low valuation is a bargain. One of the most common mistakes investors make when learning how to evaluate companies for investing is assuming that a low price automatically signals undervaluation.
Sometimes a stock is cheap for good reason.Declining earnings, weakening cash flows, excessive debt, or unsustainable dividends can all indicate a value trap. That is why I always dig deeper into the fundamentals.
I look for consistent earnings growth, strong and reliable cash flows, and a healthy balance sheet. I also consider qualitative factors such as management quality, competitive advantages, and long-term business prospects. Proper valuation requires investors to evaluate not just price, but business quality, which is essential when determining whether a company’s valuation is justified.
Examples of potential value traps include:
Sound valuation is about more than statistics. It is about understanding the business, the risks involved, and the sustainability of results.
Determining what a stock is worth is both an art and a science. By focusing on business fundamentals, applying sound valuation metrics, and using tools like the Fundamentals Analyzer, investors can make informed decisions grounded in reality rather than speculation.
Valuation is not about chasing returns or predicting market movements. It is about purchasing stocks at valuations that allow investors to fully participate in the operating results of the underlying business. Investors who focus on valuation rather than price place themselves in a far stronger position for long-term success.
What is considered a good P/E ratio when determining a stock’s value?
A “good” P/E ratio depends on the company, industry, and growth prospects.Historically, a P/E of approximately 15 has often represented fair value. A 15P/E equates to an earnings yield of 6.67%, which aligns with both a reasonable minimum return expectation and the lower range of long-term historical equity returns.
Why does the P/E ratio differ betweenGAAP earnings and adjusted earnings?
GAAP earnings include all accounting items, while adjusted earnings exclude certain one-time or non-cash items. This can lead to different P/E ratios, so investors should always understand which earnings figure is being used.
What are value traps in stock investing?
A value trap is a stock that appears cheap based on valuation metrics but is actually experiencing deteriorating fundamentals or long-term business challenges.
How should investors approach stock valuation?
Investors should combine quantitative analysis—such as valuation ratios and cash flow metrics—with qualitative research into the business, management, and competitive position. Tools like FAST Graphs help place valuation into proper perspective. The central idea is to purchase stocks at valuations that allow full participation in business results over time.
Happy investing, and always remember: focus on value, not just price.
FAST Graphs™ is a stock research tool that empowers subscribers to conduct fundamental stock research deeper and faster than ever before.