Many people see the stock market as a casino, but according to Chuck Carnevale, co-founder of FAST Graphs and “Mr. Valuation,” the truth is far more rational. How does the stock market work? The market isn’t about luck — it’s a mechanism for allocating capital and rewarding disciplined investors who understand value.
If you’ve ever wondered how the stock market works or how to use it to make money intelligently, this summary breaks it down in simple, timeless terms.
The stock market is a platform where ownership in real businesses is bought and sold.
It reflects investors’ collective judgment about value, opportunity, and risk—not randomness.
When optimism dominates, prices rise beyond fair value. When fear strikes, prices drop below it.
In the long run, fundamentals—not emotions—drive results.
The market functions like an auction house guided by supply and demand:
Buying a stock means buying a real piece of a company—its assets, earnings, and cash flow.
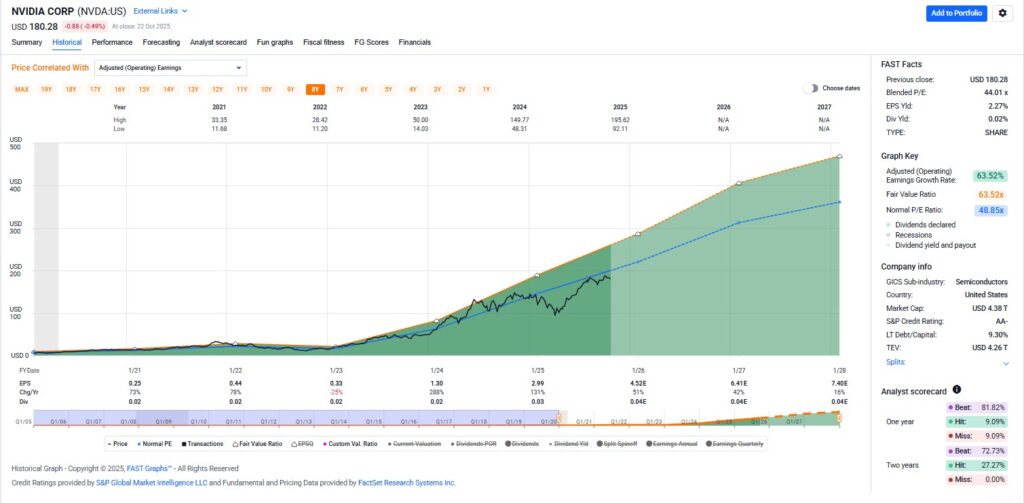
FAST Graphs helps visualize this relationship by comparing price (black line) to earnings (orange line), showing when stocks trade above or below intrinsic value.
Companies issue shares to raise capital for growth, innovation, or dividends.
When you buy shares, you become a partial owner—a shareholder—participating in both profits and risks.
Public companies must disclose their financials, giving investors insight into profitability, growth, and management quality.
Transparency allows for intelligent investing, grounded in facts rather than speculation.
Over time, stock prices gravitate toward true business value—what Chuck calls the “orange line of intrinsic worth.”
When prices fall below this value, they tend to rebound. When they rise above it, they eventually correct.
FAST Graphs shows this visually, helping investors spot when a stock is overvalued, undervalued, or fairly valued.
Patience and discipline pay off because in the end, earnings growth drives stock performance.
Examples:
Investors focus on fair value and hold for the long term, letting compounding work in their favor.
Traders attempt to time market highs and lows—a nearly impossible task that often leads to losses.
As Ben Graham said and Chuck reminds us:
“In the short run, the market is a voting machine; in the long run, it’s a weighing machine.”
Successful investing means thinking like a business owner, not a speculator.
Brokers are facilitators—they execute trades, but investors are responsible for their own research.
FAST Graphs is designed to make that research visual, simple, and effective—helping investors evaluate earnings, growth, and valuation in seconds.
Regulators like the SEC ensure fairness and transparency, while indexes such as the S&P 500 serve as performance benchmarks.
The stock market fuels economic growth, innovation, and personal wealth creation.
For beginners and professionals alike, learning how the market works is key to long-term success.
When you use a research tool like FAST Graphs, you can see value clearly, ignore the noise, and make informed, confident decisions.
“Ignore the hype. Focus on fundamentals. Mind your own businesses.” – Chuck Carnevale
Ready to invest smarter?
Start analyzing your favorite stocks with FAST Graphs, the Fundamentals Analyzer Software Tool trusted by thousands of value-minded investors.
Try FAST Graphs for FREE Today!
SUBSCRIBE to our YouTube Channel
Click here for our Research Articles
Disclosure: Long NVDA, FI, AMZN, AMP, O
Disclaimer: The opinions in this document are for informational and educational purposes only and should not be construed as a recommendation to buy or sell the stocks mentioned or to solicit transactions or clients. Past performance of the companies discussed may not continue and the companies may not achieve the earnings growth as predicted. The information in this document is believed to be accurate, but under no circumstances should a person act upon the information contained within. We do not recommend that anyone act upon any investment information without first consulting an investment advisor as to the suitability of such investments for his specific situation.
FAST Graphs™ is a stock research tool that empowers subscribers to conduct fundamental stock research deeper and faster than ever before.