Earnings drive long-term stock prices. Mastering fundamental analysis is the surest way to invest with confidence, discipline, and long-term success.
After more than five decades in the securities industry, I can say with conviction that fundamental analysis is the bedrock of sound investing. From my earliest days on Wall Street to co-founding FAST Graphs, I’ve seen fads come and go, but one principle remains: the business behind the stock is what matters most.
In this article, I will walk you through the principles, types, and practical applications of fundamental analysis in stocks, sharing the lessons and tools that have shaped my career and helped countless investors make better decisions based on fundamental data rather than speculation.
Fundamental analysis is the systematic evaluation of a company’s intrinsic value by examining its financial statements, business model, industry position, and the broader economic environment. Unlike the daily noise of market prices, fundamental stock analysis focuses on the underlying business performance, or stock fundamentals, that drive long-term returns.
In my experience, understanding the business behind the ticker is the only way to invest with conviction. Successful company fundamental analysis looks beyond price fluctuations to study real-world business performance — the earnings, cash flow, and balance sheet strength that determine the fundamental value of a stock.
The process of fundamental analysis of stocks follows a logical approach. We analyze industry-specific trends and competitive dynamics. Then we dive deep into company analysis in fundamental analysis — reviewing revenue growth, profit margins, balance sheet strength, and management quality.
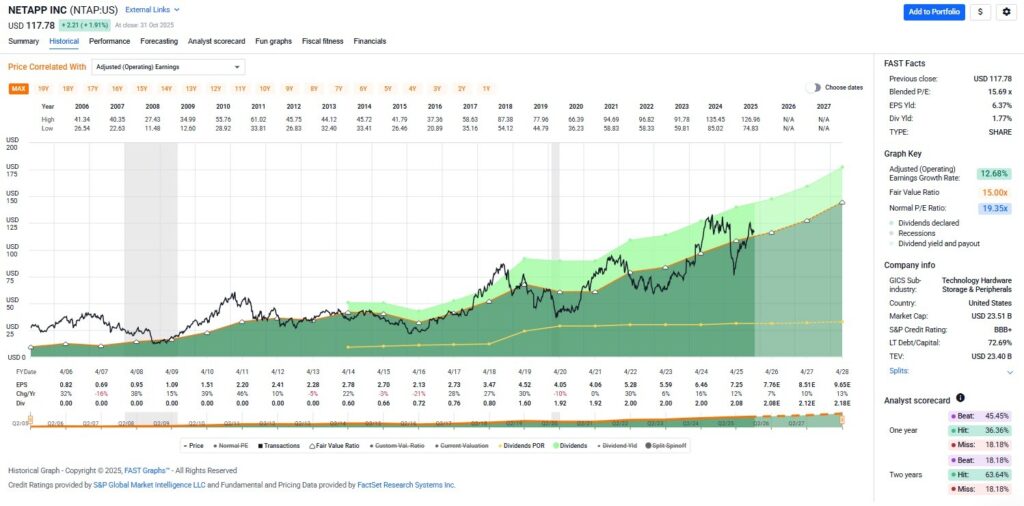
This approach allows us to determine whether a stock is trading above, below, or at its fundamental value. The “orange line” in FAST Graphs, representing intrinsic value, has always been my north star. When stock prices deviate from this line, opportunities arise for disciplined investors who understand what they’re buying.
The orange line on FAST Graphs is provided by widely accepted formulas rooted in discounted cash flow analysis, creating an intrinsic value reference line. These charts illustrate the operating history and success of the business behind the stock, showing how stock fundamental data aligns with long-term performance.
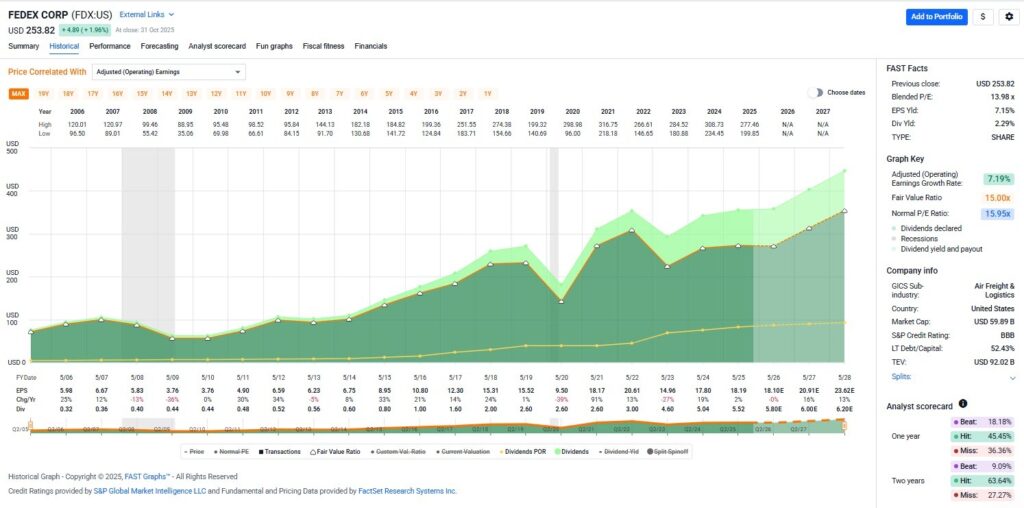

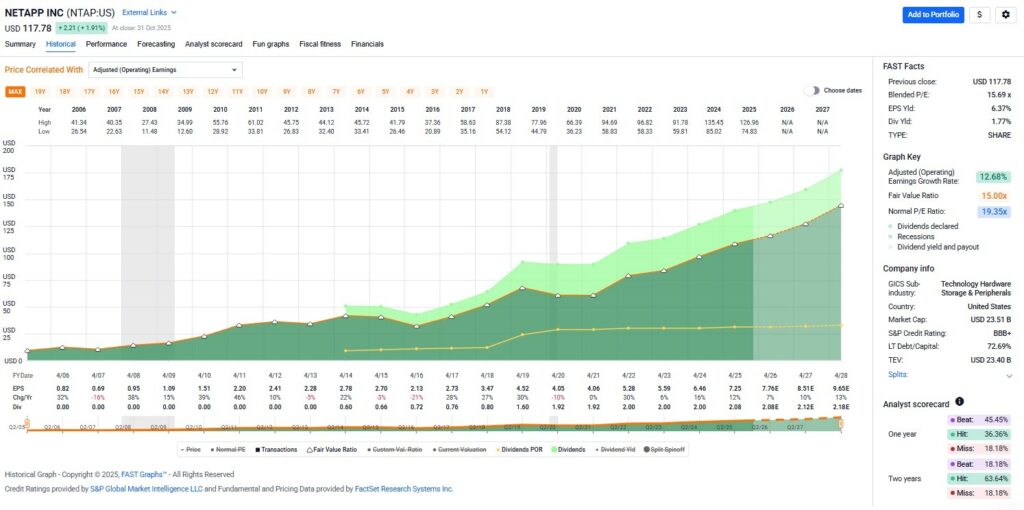
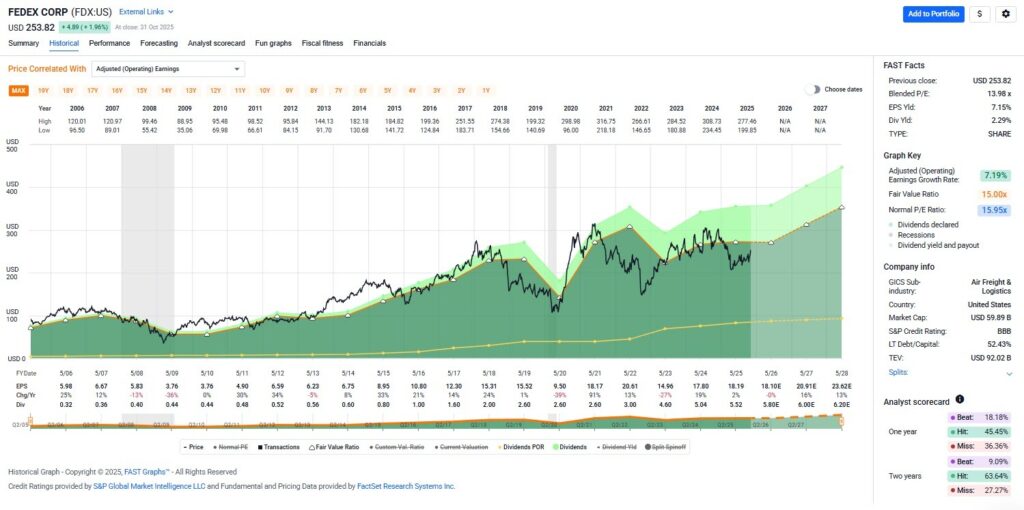
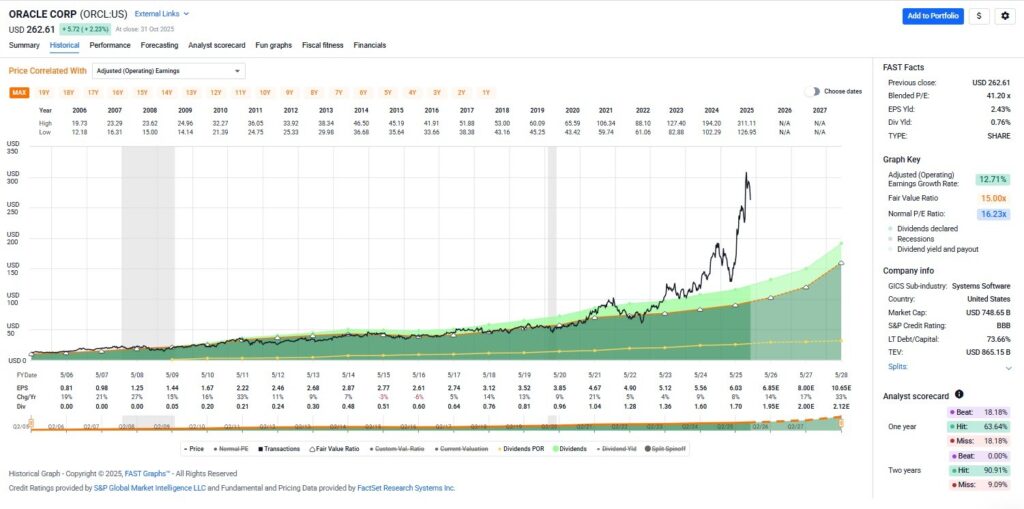
When stock prices are added to the graphs, the correlation between price and earnings becomes clearly apparent. This provides long-term proof of the importance of the intrinsic value reference line. In the long run, stock prices go where earnings go, and when they temporarily disconnect, they inevitably move back into alignment with their true fundamental worth.
Over the years, I’ve seen investors chase hot tips and market fads, often to their detriment. Fundamental analysis in stocks provides the antidote to emotional investing by grounding decisions in objective, measurable data. When you understand the fundamental value of a stock, you protect yourself from overpaying during market euphoria and position yourself to capitalize when quality businesses trade at discounts.
Long-term wealth creation is driven by consistent earnings growth. Companies that grow earnings, maintain competitive advantages, and operate with financial discipline reward patient investors over time. Fundamental research gives you the confidence to hold through volatility, knowing your decisions are based on facts, not speculation.
As I always say, “Ignore the hype. Focus on fundamentals. Mind your owned businesses.”
Naturally, as cofounder of FAST Graphs, that is my go-to source to examine fundamental data. FAST Graphs gathers, organizes, and presents essential stock fundamentals at a glance. I know of no better way to examine the important fundamentals of an operating business than by using this powerful fundamentals analyzer software tool.
Thanks to FAST Graphs, reliable fundamental stock data has never been easier to analyze or evaluate — but knowing where to look is crucial. Here’s where I go in FAST Graphs for comprehensive company fundamental analysis:
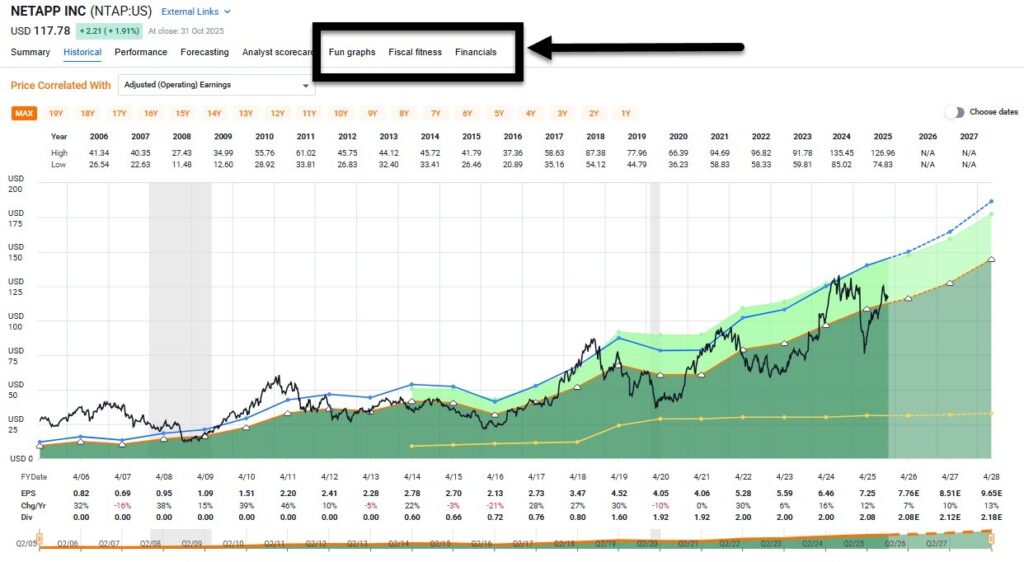
Additionally, FAST Graphs provides an “external links” drop-down that takes you to the company’s website and other financial sites that provide research and insights, for deeper fundamental research.
Mastering the annual report is fundamental to successful equity fundamental analysis. Here’s my step-by-step approach:
Key Finding:
The annual report isn’t just numbers — it’s the story of a business. Read it with a critical, inquisitive eye.
Effective equity fundamental analysis balances hard numbers with soft insights.
Quantitative Analysis
This is the realm of measurable metrics:
These fundamental indicators for stocks provide objective benchmarks. Tools like FAST Graphs visualize these relationships, making it easier to spot undervalued opportunities.
Qualitative Analysis
Numbers alone don’t tell the whole story. Assess:
Key Takeaway:
Quantitative analysis tells you what’s happening; qualitative analysis tells you why — and whether it’s sustainable.
The debate between fundamental analysis of stocks and technical analysis is as old as the market itself.
Fundamental Analysis
Technical Analysis
I reject technical analysis as a timing tool because it can’t answer the most important question: What am I buying, and why? In my experience, fundamental stock analysis is the only way to invest with conviction and discipline.
No approach is perfect. Here are the main limitations:
Summary Box:
Fundamental analysis is powerful, but not infallible. Use it as your compass, but stay humble and adaptable.
In my five decades as “Mr. Valuation,” I’ve seen that fundamental analysis is the surest path to long-term investment success. By focusing on earnings, valuation, and business quality, you can navigate market cycles with confidence.
Remember: Earnings drive long-term stock prices. Do your homework, trust the fundamentals, and invest with discipline.
What Are the Tools for Fundamental Analysis?
Key tools include financial statements, ratio analysis, discounted cash flow models, and platforms like FAST Graphs. Free resources such as SEC filings and company websites also enhance fundamental research.
How Does Fundamental Analysis Differ from Technical Analysis?
Fundamental analysis determines intrinsic value by examining business performance and financial health. Technical analysis studies price patterns, but short-term movements remain unpredictable.
Why Is Earnings Per Share (EPS) Important in Fundamental Analysis?
EPS measures profitability per share and underpins most valuation metrics. Consistent, growing EPS signals strong business performance and drives long-term stock prices.
Valuation matters, and it matters a lot. Invest smarter by focusing on the fundamentals and letting the market’s short-term noise become your long-term opportunity.
FAST Graphs™ is a stock research tool that empowers subscribers to conduct fundamental stock research deeper and faster than ever before.