by Chuck Carnevale
Analyzing financial data is the cornerstone of sound investing. With the right tools—like the Fundamentals Analyzer Software Tool (FAST Graphs), you can transform raw numbers into actionable insights, avoid costly mistakes, and make decisions rooted in fact, not emotion.
Whether you’re performing investment analysis, detailed financial statement analysis, or broader valuation analysis, disciplined work with reliable tools turns complexity into clarity.
Financial data analysis is the systematic examination of a company’s financial statements, ratios, and performance metrics to understand its fiscal health and investment potential.
Through my experience with FAST Graphs, I’ve seen how this process transforms raw numbers into actionable insights. It involves evaluating income statements, balance sheets, cash flow statements, and key ratios to determine whether a stock represents good value at its current price. This structured approach lies at the heart of company financial analysis, fundamental analysis, and reliable investment analysis, empowering investors to interpret business results in a way that supports wise decision-making and long-term success.
Throughout my decades of experience, I’ve relied on four core methods when analyzing financial data with tools like FAST Graphs:
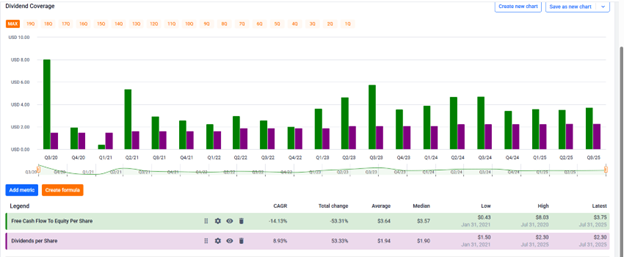
I examine income statements to understand revenue growth and profitability trends, balance sheets for financial strength, and cash flow statements for operational efficiency. Our FUN Graphs feature breaks down these underlying numbers beautifully. The following is an example of Home Depot’s dividend coverage utilizing FUN Graphs at a glance, you can see that the green bar free cash to equity is higher than the purple bar dividends per share:
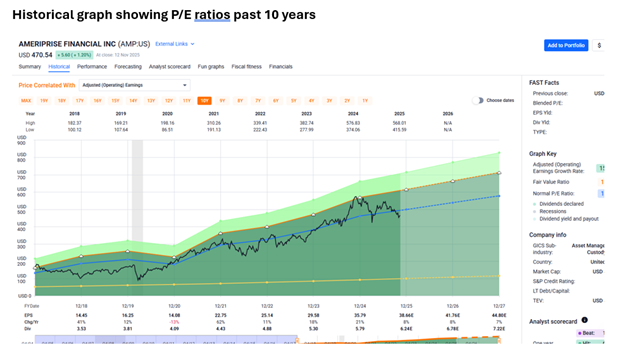
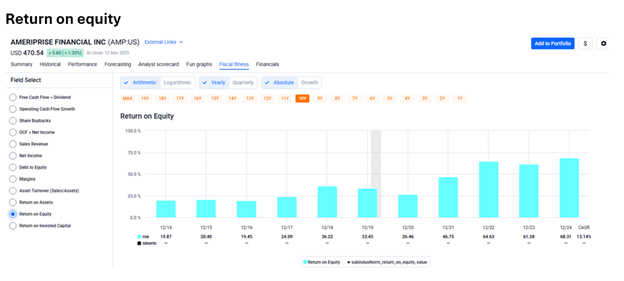
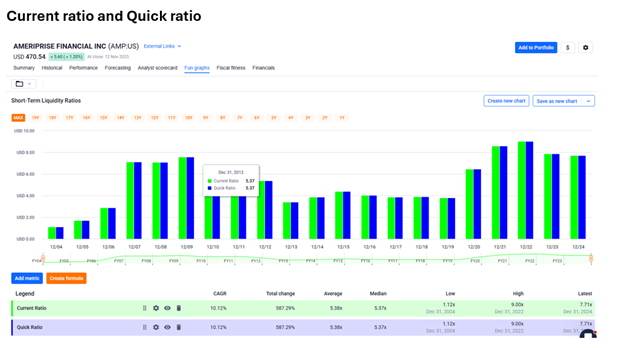
Here, I calculate and compare key metrics like P/E ratios, return on equity, debt-to-equity, and current ratios. FAST Graphs automatically compute these ratios, making the process incredibly efficient.
This form of ratio analysis helps separate solid businesses from those merely riding favorable headlines. Automating these calculations allows investors to focus on interpretation rather than number crunching.
Using up to 20 years of historical data, I identify patterns in earnings growth, dividend payments, and valuation metrics. The visual correlation between operating results and stock price performance becomes crystal clear.
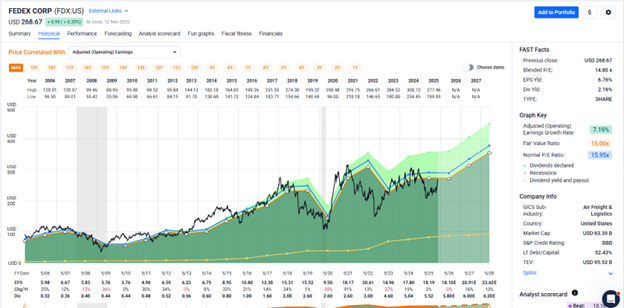
Visualizing these patterns through trend analysis reveals whether performance is improving, stable, or deteriorating, a key factor when judging long-term prospects.
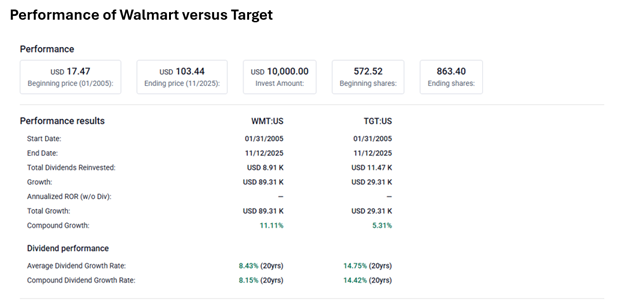
This allows me to evaluate companies against industry peers and market benchmarks. Through comparative analysis, I can see when a stock is overvalued relative to similar companies or historical norms, saving investors from costly mistakes and poor investment decisions.
Let me share practical examples from my FAST Graphs experience. When assessing profitability, I examine income statements, comparing operating margins and return on invested capital over multiple years. For liquidity evaluation, I use ratio analysis on dividend aristocrats, checking current ratios and cash positions to ensure dividend sustainability.
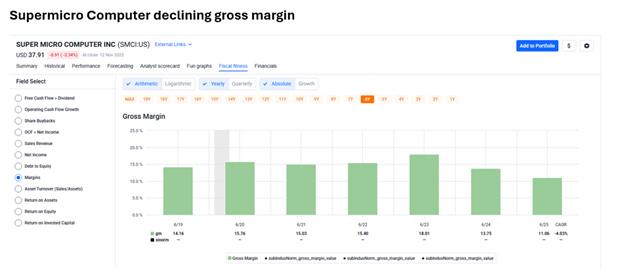
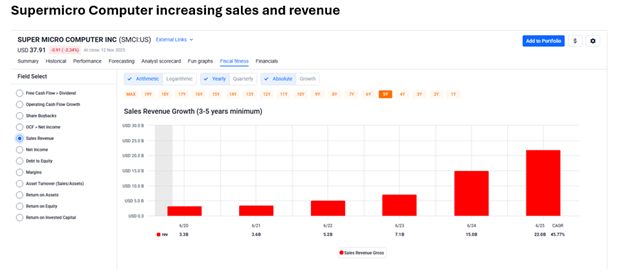
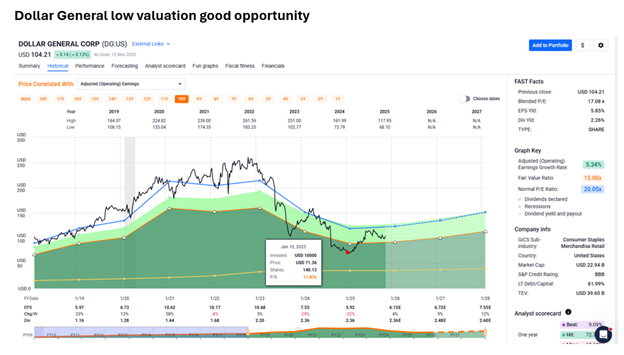
Recently, I analyzed a technology company showing declining gross margins despite revenue growth, a red flag visible in the FUN Graphs breakdown. Another example involves trend analysis: I identified a retail stock trading at historically low P/E ratios during a temporary earnings dip, presenting an excellent value opportunity. These real-world applications demonstrate how systematic financial statement analysis, balance sheet analysis, and cash flow analysis transform complex data into clear investment decisions.
After decades of analyzing financial data, I’ve developed key strategies that ensure reliable results:
Financial data analysis drives strategic decision-making in ways that fundamentally separate successful investors from those who merely speculate. When I created FAST Graphs, my goal was to democratize the kind of rigorous analysis that institutional investors use daily.
This systematic approach enhances fundamental analysis, financial performance analysis, and investment analysis by revealing the true relationship between a company’s operational success and its stock price performance.
The process identifies risks and opportunities that aren’t visible from casual observation. I’ve seen countless investors miss warning signs, declining gross margins, increasing debt loads, or deteriorating return on equity, that proper analysis would have revealed. Conversely, I’ve identified exceptional value opportunities when strong companies temporarily trade below their intrinsic worth.
Financial analysis supports forecasting and planning by establishing baseline expectations for future performance. Using historical trends and current metrics, I can reasonably estimate whether a company’s current valuation reflects realistic growth assumptions or speculative excess.
Most importantly, this discipline removes emotion from investment decisions. When you base choices on objective financial data rather than market sentiment or headlines, you make better long-term decisions. The numbers don’t lie, and they certainly don’t panic during market volatility. This analytical foundation has been the cornerstone of my investment philosophy for over five decades.
The benefits of systematic financial analysis extend far beyond simple stock selection.
Through tools like FAST Graphs, I’ve experienced how proper financial statement analysis, ratio analysis, and trend analysis dramatically improve investment outcomes. Risk management becomes more effective, efficiency improves, and investors develop a deeper understanding of how companies generate profits and cash flow.
Time efficiency increases substantially with the right tools. What once took hours of manual calculation now happens automatically, allowing me to analyze more opportunities in less time. This efficiency is particularly valuable for individual investors who can’t dedicate entire days to research.
Finally, you develop a deeper understanding of business operations. Reading financial statements and analyzing ratios teaches you how businesses actually generate profits and cash flow, making you a more sophisticated investor overall.
Despite its many benefits, company financial analysis is not without challenges. The sheer volume of data can be overwhelming, especially for those new to investing. It’s easy to get lost in a sea of ratios and metrics, losing sight of what truly matters for a specific investment thesis.
Data quality and consistency are ongoing concerns. Even with automated tools like FAST Graphs, discrepancies can arise from different reporting standards or data sources. That’s why I always recommend cross-referencing critical numbers and understanding the context behind the figures.
Another challenge is the risk of confirmation bias, seeing what you want to see in the data. It’s crucial to approach analysis with an open mind and a willingness to adjust your thesis as new information emerges.
Finally, markets are dynamic. What worked yesterday may not work tomorrow. Regularly updating your analysis and staying informed about industry trends is essential to maintaining an edge.
In my five decades of investing, I’ve learned that analyzing financial data is both an art and a science. With the right tools and a disciplined approach, you can uncover opportunities, avoid pitfalls, and build lasting wealth.
Mastering fundamental analysis, financial statement analysis, and investment analysis empowers investors to make confident, fact-based decisions. Stay curious, stay diligent, and let the data guide your decisions.
What is the purpose of financial data analysis?
Evaluate a company's financial health, performance, and value.
How can automation improve financial data analysis?
Financial statement analysis, ratio analysis, trend analysis, and comparative analysis.
Why is data accuracy important in analysis?
Inaccurate numbers can lead to poor conclusions, always cross-check critical figures.
How often should financial data analysis be conducted?
At least quarterly, aligned with earnings releases.
FAST Graphs™ is a stock research tool that empowers subscribers to conduct fundamental stock research deeper and faster than ever before.