In this video, Chuck Carnevale, co-founder of FAST Graphs and known as Mr. Valuation, takes a deep look at FactSet Research Systems (FDS) — time to buy? The company that provides data to FAST Graphs itself. FactSet has always been known as a high-quality, consistent business, but Chuck uses it to illustrate an important investing truth:
Valuation matters, and it matters a lot.
FactSet has been a favorite among investors for years because of its strong business model, recurring revenue, and reliable growth. But the market has almost always priced it at a premium — often 25 to 30 times earnings, which is far above what most would consider fair value.
Chuck points out that such a high multiple means investors have historically been willing to pay 25 years of earnings in advance, leaving them with a very low earnings yield, usually below 4%. That’s a steep price for even the best company.
For the first time in decades, FactSet’s stock fell sharply — over 40% from 2024 to 2025.
Chuck explains what caused this rare correction:
Even though revenue still grew nearly 6% year-over-year, the market reacted strongly. Chuck believes this drop had more to do with valuation and sentiment than with any serious business weakness.
FactSet remains a strong, steady company:
Chuck emphasizes that the fundamentals look fine. FactSet’s business is stable, its products are essential to clients, and it generates predictable cash flow. The problem wasn’t the company — it was how much investors were paying for it.
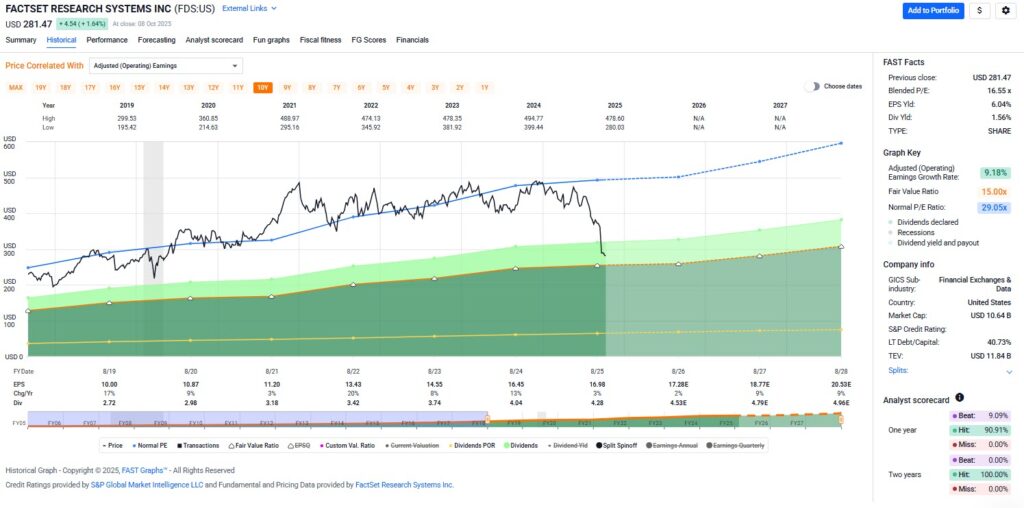
Using FAST Graphs, Chuck shows how the orange line (earnings) and the black line (price) relate over time.
Whenever the black line moves far above the orange line, the stock is overvalued. When it moves below, it’s undervalued.
FactSet has almost always traded well above its fair-value line — except for a brief period during the 2008–2009 recession. Chuck says that would have been the only time he’d have bought it. He doesn’t believe in overpaying for great companies, no matter how consistent they are.
Chuck explores different potential outcomes:
That’s the power — and the risk — of valuation swings. A company’s quality can stay the same, but when sentiment changes, prices can move dramatically.
Chuck admits he’s never fully understood why the market has rewarded FactSet with such a high multiple for so long.
It’s not growing faster than peers like Ameriprise or Ecolab, which trade at much lower valuations.
But the market often places a premium on stability and reliability — similar to how investors have long paid up for Coca-Cola or Procter & Gamble, even with slower growth.
Still, Chuck reminds viewers that quality doesn’t justify any price. Buying even the best business at too high a valuation can lead to poor long-term returns.
One of Chuck’s main takeaways is that stock prices are volatile, but fundamentals are not.
He uses FAST Graphs to show how investors who bought near fair value enjoyed strong gains, while those who bought at peak valuations saw years of flat or even negative total returns.
Chuck contrasts FAST Graphs with basic tools like Yahoo or Google Finance, which only show price history. FAST Graphs goes deeper — combining price, earnings, cash flow, and fair-value lines — helping investors see the business behind the stock.
It’s what Chuck calls “essential fundamentals at a glance.” Investors can instantly see when a stock is cheap, expensive, or fairly valued without spending hours digging through financial reports.
FactSet is still an outstanding company — profitable, dependable, and well-managed. Is it a company that it’s time to buy?
The recent selloff has brought the stock closer to a reasonable valuation, though Chuck still sees it as fully valued by intrinsic standards.
If the market eventually restores its traditional premium multiple, returns could be excellent. If not, investors can still expect modest but steady growth and dividends.
Either way, the key takeaway is timeless:
“Valuation matters, and it matters a lot.”
Chuck closes by reminding viewers to like, subscribe, and check out FAST Graphs to gain this same kind of insight for their own investments — because understanding valuation is the key to investing wisely.
Try FAST Graphs for FREE Today!
SUBSCRIBE to our YouTube Channel
Disclosure: No position.
Disclaimer: The opinions in this document are for informational and educational purposes only and should not be construed as a recommendation to buy or sell the stocks mentioned or to solicit transactions or clients. Past performance of the companies discussed may not continue and the companies may not achieve the earnings growth as predicted. The information in this document is believed to be accurate, but under no circumstances should a person act upon the information contained within. We do not recommend that anyone act upon any investment information without first consulting an investment advisor as to the suitability of such investments for his specific situation.
FAST Graphs™ is a stock research tool that empowers subscribers to conduct fundamental stock research deeper and faster than ever before.