By Chuck Carnevale, “Mr. Valuation”
Calculating dividend growth is at the heart of sound, fundamentals-driven dividend growth investing. By leveraging tools like the FAST Graphs (Fundamentals Analyzer Software Tool), investors can visualize, quantify, and compare dividend growth rates to make rational, fact-based decisions focused on long-term wealth building.
Chuck Carnevale here many of you know me as“Mr. Valuation.” Over my decades in the investment world, I’ve learned that understanding and calculating dividend growth is one of the most powerful disciplines an investor can develop. Dividend growth is not just about income; it is about measuring business success, financial strength, and management commitment over time.
Using the FAST Graphs’ FundamentalsAnalyzer tool, I will walk you through the essential concepts behind dividend growth and explain how to properly calculate dividend growth rates. My objective is simple: to help you make informed, disciplined investment decisions grounded in fundamentals, valuation, and long-term thinking.
When I refer to dividend growth, I am talking about the annual increase in the dividend a company pays to its shareholders. Dividend growth is one of the clearest indicators of a company’s underlying financial health and the confidence management has in the durability of future earnings.
In my experience, companies that demonstrate a long-term commitment to increasing dividends typically exhibits table cash flows, strong balance sheets, and shareholder-friendly capital allocation policies. These are not short-term stories, they are businesses built to endure.
From a practical standpoint, focusing on businesses with a consistent record of dividend growth can provide investors with two critical benefits: rising income over time and greater peace of mind. When dividend growth is supported by earnings growth, it becomes a powerful compounding force within a well-constructed portfolio.
Dividend yield is a simple, yet powerful, measurement that every dividend investor should understand. It tells you how much current income you are receiving for every dollar invested and is calculated by dividing the annual dividend per share by the current stock price.
For example, if a company pays $2.00 per share in annual dividends and the stock is trading at $50, the dividend yield is 4%. While this calculation is straightforward, its interpretation requires context. Yield, by itself, does not tell the whole story.
This is where tools like the FAST Graphs’Fundamentals Analyzer Software Tool, become especially useful. They allow you to compare a company’s current dividend yield to its historical norms. In my experience, this visual perspective often reveals whether a stock may be undervalued, fairly valued, or overvalued based on its dividend yield relative to its long-term averages.
Importantly, a higher yield is not always better. An unusually high dividend yield can sometimes be a warning sign, particularly if it is the result of a declining stock price caused by weakening fundamentals. Therefore, dividend yield should always be evaluated in conjunction with earnings, payout ratios, and dividend growth to gain a complete and accurate picture.
The annualized payout represents the total amount of dividends an investor can expect to receive over a full year, based on the company’s most recent dividend payment and its payment frequency.This metric provides clarity when comparing income potential across different dividend-paying stocks.
For instance, if a company pays a quarterly dividend of $0.50 per share, the annualized payout is $2.00. While the math is simple, the usefulness of this figure should not be underestimated. When calculating dividend growth, understanding the annualized payout establishes the baseline from which growth is measured.
The Fundamentals Analyzer within FASTGraphs automatically calculates the annualized payout and displays it alongside historical dividend data. This allows investors to quickly assess whether dividend increases are consistent, accelerating, or slowing over time.
From a practical standpoint, the annualized payout helps investors align dividend income expectations with portfolio objectives. Whether you are building an income stream for retirement or reinvesting dividends for long-term growth, this metric serves as a foundational reference point in any dividend growth investing strategy.
The payout ratio measures how much of a company’s earnings are being paid out as dividends. It is calculated by dividing annual dividends per share by earnings per share (EPS). In my experience, this is one of the most important metrics to evaluate when assessing both dividend safety and future dividend growth potential.
A moderate payout ratio, generally in the range of 40% to 60% often reflects a healthy balance between rewarding shareholders and retaining sufficient earnings to reinvest in the business.Companies operating within this range typically have greater flexibility to continue raising dividends, even during periods of slower earnings growth.
On the other hand, an excessively high payout ratio can be a red flag. If a company is distributing too much of its earnings, it may have limited capacity to sustain dividend growth during economic downturns or periods of declining profitability. This is particularly important when calculating dividend growth, as future increases must ultimately be supported by earnings.
The Fundamentals Analyzer within FASTGraphs provide clear visual representations of payout ratios over time, allowing investors to quickly identify trends and potential stress points. As I often emphasize, dividends are paid from earnings, and earnings matter a lot.
Calculating dividend growth is straightforward when approached logically and supported by the proper tools.One of the most widely accepted and reliable methods is the Compound AnnualGrowth Rate (CAGR), which measures the average annual rate at which a dividend has grown over a specific period of time.
The formula for calculating dividend growth using CAGR is as follows:
Dividend Growth Rate = [(Final Dividend ÷Initial Dividend)^(1 ÷ Number of Years)] – 1
For example, if a company’s annual dividend increases from $1.00 to $1.21 over a two-year period, the compound annual growth rate is 10%. This calculation allows investors to normalize dividend growth across different timeframes and make meaningful comparisons.
In practice, manually calculating dividend growth for multiple companies and time periods can be cumbersome. This is where the FAST Graphs Fundamentals Analyzer Software adds significant value. This tool automatically calculates dividend growth rates over various periods such as 1-year, 3-year, 5-year, and 10-year timeframes allowing investors to visualize trends and assess consistency.
When calculating dividend growth, consistency is often more important than short-term acceleration. A steady, predictable growth rate supported by earnings growth is typically more sustainable and reliable than erratic or overly aggressive increases. In my experience, companies that demonstrate long-term dividend growth discipline are far more likely to deliver durable income and long-term total return.
In my experience, dividend growth investing offers several compelling advantages, particularly for investors focused on long-term wealth accumulation and rising income. When dividend stocks are evaluated properly using fundamentals, valuation, and disciplined analysis, they can serve as the backbone of a high-quality investment portfolio.
Steady Income
Regular dividend payments provide a reliable stream of income, which isespecially valuable for retirees or investors seeking passive cash flow. Whenviewed through the lens of FAST Graphs, the dividend line is often themost predictable and dependable analytical line on the chart.
The Power of Compounding
Reinvesting dividends can significantly enhance long-term returns through the power of compounding. As dividends grow and are reinvested, investors benefit from both increasing income and capital appreciation over time.
Lower Volatility
Dividend-paying stocks particularly those with a history of consistent dividend growth tend to exhibit lower volatility than non-dividend-paying stocks. During market corrections, dividends can help cushion total return and reduce emotional decision-making.
A Quality Indicator
Consistent dividend growth is often a sign of strong management, durable earnings power, and sound capital allocation policies. Companies that raise dividends year after year typically possess business models that are built to withstand economic cycles.
Tax Efficiency
Qualified dividends may be taxed at favorable rates compared to ordinary income, enhancing after-tax returns for many investors. This tax advantage further reinforces the appeal of dividend growth investing for taxable portfolios.
Many investors refer to dividend growth in terms of “yield on cost.” While the concept is valid, I prefer to think of it as growth yield, a reflection of rising income generated by owning high-quality businesses over time, not simply a static yield calculation.
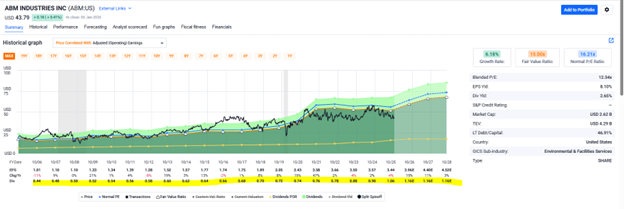
ABM Industries Inc. provides a classic real-world illustration of the principles behind calculating dividend growth and evaluating dividend sustainability. ABM is a well-established DividendChampion, having increased its dividend for decades, and it clearly demonstrates how consistent dividend growth reflects underlying business strength.
When viewed on a FAST Graph, the dividend is represented by the gold line. What immediately stands out is the steady and predictable nature of that line. Year after year, ABM has increased its dividend, offering shareholders a growing income stream supported by earnings growth.
This visual presentation is critical. By examining dividend growth alongside earnings on the same graph, investors can quickly determine whether dividend increases are being funded responsibly. In the case of ABM, the dividend growth rate aligns well with the company’s earnings growth, reinforcing the sustainability of its dividend policy.
Examples like ABM underscore why calculating dividend growth is so important. Numbers matter, but context matters more. FAST Graphs allow investors to move beyond raw calculations and see the relationship between dividends, earnings, and valuation in a clear, intuitive format. In my experience, this perspective is invaluable when making long-term dividend growth investing decisions.
Calculating dividend growth is about far more than arriving at a single percentage figure. It provides insight into a company’s financial discipline, earnings power, and long-term commitment to shareholders. When dividend growth is supported by sound fundamentals and appropriate valuation, it can become a powerful driver of both income and total return.
By utilizing fundamentals-driven tools such as the FAST Graphs, investors can evaluate dividend growth in proper context—measuring consistency, sustainability, and alignment with earnings.This approach replaces speculation with evidence and emotion with discipline.
As I often remind investors, valuation matters. Earnings matter. And when it comes to dividend growth investing, those principles matter a great deal.
What is the difference between dividend yield and dividend growth?
Dividend yield measures current income as a percentage of a stock’s price, while dividend growth measures the annual increase in dividend payments overtime. Both metrics are important, but they serve different purposes when evaluating dividend stocks.
How often do companies typically pay dividends?
Most U.S. companies pay dividends on a quarterly basis. However, some companies pay monthly, semi-annually, or annually, depending on their structure and geographic location.
What does a high payout ratio indicate about a company?
A high payout ratio means a large portion of earnings is being paid out as dividends. While this may be sustainable in some cases, it can also limit future dividend growth and increase risk if earnings decline.
Is dividend investing safer than growth investing?
Dividend investing is generally associated with lower volatility and greater income stability, making it attractive for income-focused or risk-conscious investors. Growth investing, on the other hand, may offer higher return potential but typically comes with greater price volatility.
By focusing on calculating dividend growth and applying a fundamentals-driven analytical process, investors can identify high-quality companies, manage risk more effectively, and construct portfolios designed to deliver both rising income and long-term capital appreciation.
FAST Graphs™ is a stock research tool that empowers subscribers to conduct fundamental stock research deeper and faster than ever before.