As most everyone knows, Warren Buffett received much of his initial investing education from the father of modern security analysis, the venerable Ben Graham. Personally, I attribute most everything I know about investing from reading the teachings of both Graham and Buffett. To me, it only made sense to learn as much as I could from the very best; these two distinguished and legendary investors certainly meet the criteria.
Therefore, I was very excited to come across several pieces of Graham’s work courtesy of ValueHuntr, entitled Common Sense Investing: The Papers of Benjamin Graham Written by Benjamin Graham.
From as best I can tell, most of these papers were written in the 1970s, and therefore require a modest amount of interpretation and extrapolation to make them relevant to modern times. Nevertheless, these papers contain many pearls of Graham’s investment acumen and wisdom.
As I was conducting routine research on the Coca-Cola Company (
KO), it struck me that Buffett may have been violating several of Graham’s most important lessons by owning Coca-Cola stock over the last 15 or so years. The following excerpts from Graham’s papers speak to my contention regarding Buffett’s possible mistake:
The Past and Future of Common Stocks …. Before I came down to Wall Street in 1914 the future of the stock market had already been forecast-once and for all-in the famous dictum of J.P. Morgan the elder: “it will fluctuate.” It is a safe prediction for me to make that, in future years as in the past, common stocks will advance too far and decline too far, and that investors, like speculators-and institutions, like individuals-will have their periods of enchantment and disenchantment with equities.
My interpretation of the above is that Graham was simply pointing out two related realities regarding the stock market. The first is that the stock market will fluctuate, and the second is that these fluctuations are not always rational or intelligent. In other words: When enchanted, stock prices can get too high, and when disenchanted, stock prices can get too low. For most of the past 15 years or so, I believe the stock market was enchanted with KO. More simply stated, Buffett was holding Coca-Cola for many years when it was dramatically overvalued.
Frankly, this confuses me, because I’m certain that Buffett knew what he was doing. Even considering his philosophy and policy of being a long-term holder of a good and profitable business that he understands, holding Coca-Cola at such high valuations seems like a mistake too obvious for him to make. Most importantly, as we will soon see below, this mistake spanned a time frame of 12-15 years. This completely rewrites the definition of being patient beyond what most mere mortals are capable of.
A few additional excerpts from the same section of Graham’s papers offered an interesting analysis of how mispricing by the stock market could be recognized. In what follows, Graham offers an interesting comparison between stock values and bond interest rates in order to determine or recognized intrinsic value.
It seems logical to me that the earning/price ratio of stocks generally should bear a relationship to bond-interest rates …. viewing the matter from another angle, I should want the Dow or Standard & Poor’s to return an earnings yield of at least four-thirds that on AAA bonds to give them competitive attractiveness with bond investments.
I found it both intriguing and astute that Graham would relate stock values to their competitiveness versus interest rates and quality bonds. To me, true investing principles always had to make sense, and this notion of Graham’s makes a great deal of sense logically and mathematically. At the end of the day, I believe an investment receives its value from the amount of cash flow it generates for its stakeholders. With common stocks, the cash flow that is usually measured is earnings. Finding the right multiple with which to capitalize earnings at is ultimately what value is all about. Therefore, Graham’s idea that you should expect an earnings yield on your stock that is greater than the yield you can earn on a AAA bond (four-thirds) makes good sense.
Coca-Cola By the Numbers: 1992 to Current “Fundamentals at a Glance”
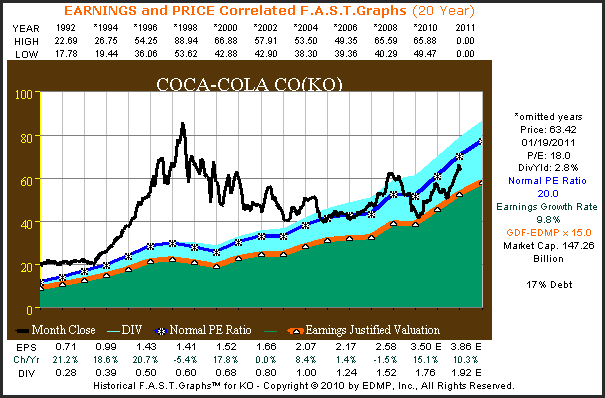
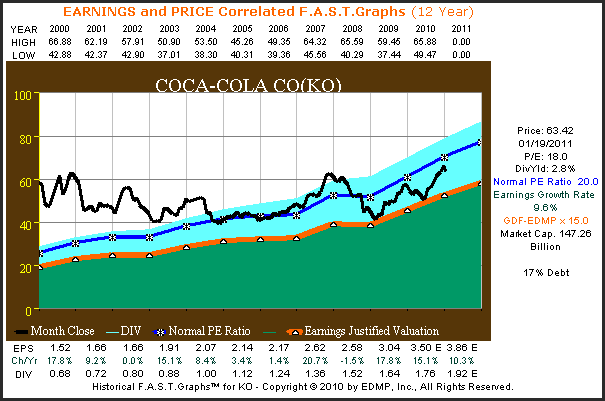
The following earnings and price-correlated F.A.S.T. Graphs™ reviews KO by the numbers, from 1992 to current. The orange line on the graph plots Coca-Cola’s earnings-per-share utilizing a modified version of Graham’s formula (GDF = Graham-Dodd Formula) for valuing a stock. The essence of this research tool is that it calculates intrinsic value based on fairly capitalizing earnings. As you can see, Coca-Cola grew earnings at a compounded rate of 9.8. The orange line with white triangles capitalizes Coca-Cola’s earnings and a PE ratio of 15.
The black line on the graph plots monthly closing stock prices for each year. Based on the formulas utilized by the F.A.S.T. Graphs research tool, fair value would exist when the black price line touches the orange line. The blue line with asterisks plots a calculated historically normal PE ratio of 20, which in Coca-Cola’s case implies a quality premium afforded to this stalwart. Nevertheless, Coca-Cola stock price was dramatically above calculated fair value for most of this time frame. Note that the stock price peaked in June of 1998 and then trended down until it finally reverted to the mean in February of 2009.
[Click all to enlarge]
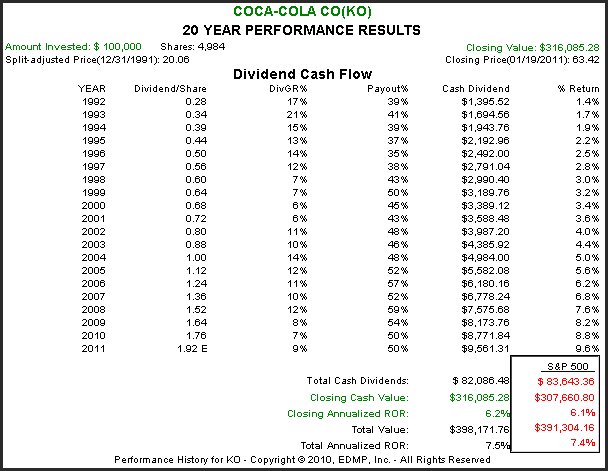
The calculated performance, including dividend income from 1992 to current, depicts KO as an almost perfectly average holding. Both capital appreciation and total dividend income was almost identical to the returns generated by the S&P 500. Theoretically, at least, Coca-Cola, based on earnings growth, should have generated its shareholders capital appreciation of just under 10% (9.8% EPS growth) with an added dividend kicker. However, the fact that its stock price was overvalued in the beginning and less overvalued at the end accounts for its only generating 6.2% capital appreciation. On the other hand, Coca-Cola’s dividend and dividend growth were much more correlated and functionally related to its earnings.
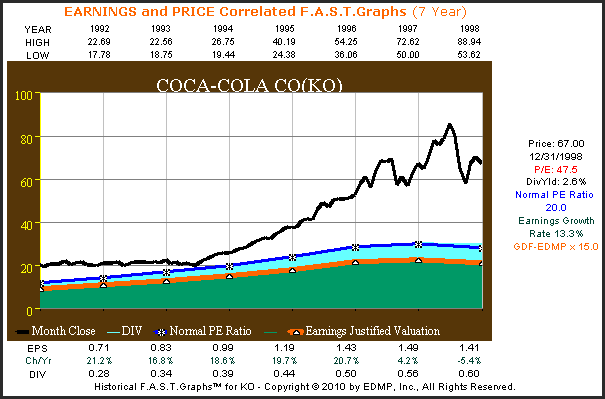
Coca-Cola: Obviously Overvalued in 1998
The graph below looks at KO over the time period 1992 through 1998. What is clear from the graph is that starting in 1994, Coca-Cola’s stock price became increasingly overvalued until it peaked in June of 1998. At its closing price on December 31, 1998, Coca-Cola was trading at a PE ratio of 47.5, which was more than 3 1/2 times its 13.3% compounded earnings growth rate. Therefore, its PEG ratio of 3.57 was excessive even though the company was growing earnings at low double-digit rates.
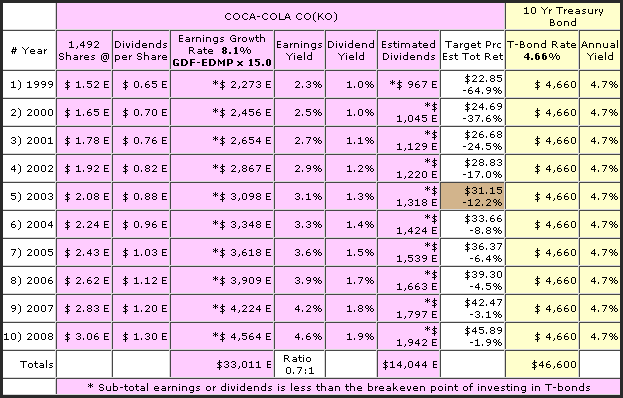
The following graph produces a table that calculates Coca-Cola’s earnings yield at this time. Most importantly, the earnings yield is compared to what could have been earned from an equivalent $100,000 investment in Coca-Cola versus a 10-year treasury bond. This chart offers the benefit of 20/20 hindsight as it calculated that KO grew earnings at the rate of 8.1% from the beginning of 1999 to the end of 2008. What the chart shows is that in 1999 and 10-year treasury bond provided a yield of 4.66%. Therefore, an investor would have received a total of $46,600 of riskless interest.
In contrast, KO would have only generated $33,011 of total earnings, of which it would have paid out only $14,044 in total cumulative dividends. In other words, Coca-Cola Company‘s earnings yield was only 70% of what could have been earned, and paid out from a 10-year treasury bond. From an income perspective, treasury bond holders would have received over three times as much riskless interest than Coca-Cola shareholders would have received in dividends over the same time frame. This is a far cry from an earnings yield “of four-thirds that on a AAA bond” that Graham wrote about.
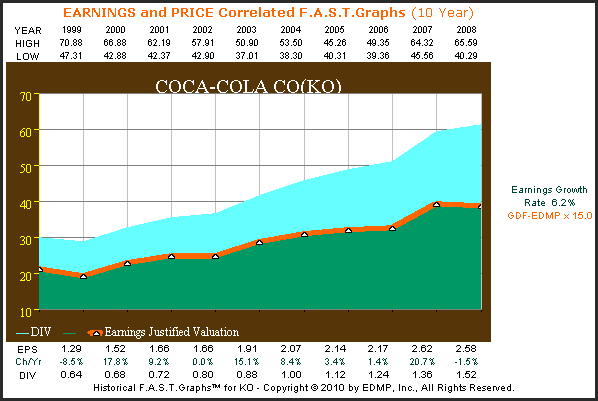
Coca-Cola 1999 to 2008: An earnings only perspective.
The following graph plots Coca-Cola’s earnings and dividends only (no stock prices) from 1999 to 2008 in order to offer a perspective on the importance of valuation. From the graph it is clear that KO generated pretty good operating results (earnings) through a period that included the recession of 2001. The light blue area indicates dividends paid to shareholders out of the green shaded earnings area. Therefore, from this perspective, Coca-Cola’s business was decent and its dividend well covered.
This next graph simply adds monthly closing stock prices and shows two important facts. First, it shows how massively overvalued the company’s stock price was at the beginning of 1999. Next, the graph shows how the stock price steadily trended downward over the entire 10-year period primarily due to its overvaluation. Notice that the company’s earnings growth rate was also a little slower here, packaging only 6.2%. However, it was more due to overvaluation than to the slowing earnings growth that cause stock prices to behave so poorly.
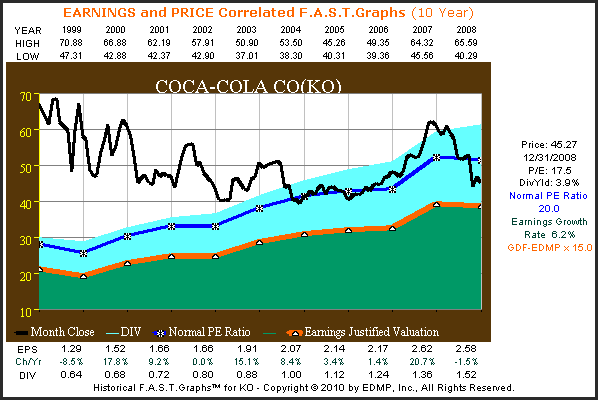
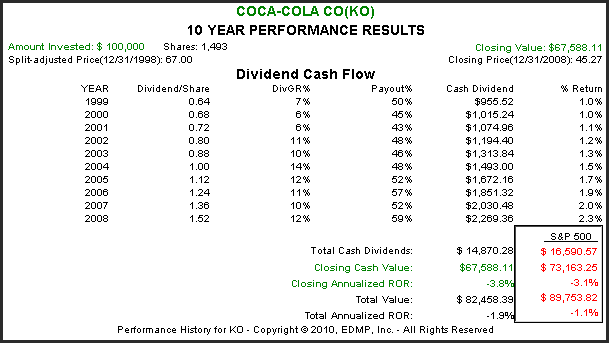
When you calculate the performance associated with owning KO stock over the 10-year period 1999 to 2008, the risk and devastation that overvaluation brings becomes vividly apparent. Even though the company’s earnings performed at a reasonably decent level, shareholders would have seen their principal erode to the tune of more than 32%. Even when you add in dividend income, which was very generously distributed, shareholders still found themselves underwater.
Coca-Cola: Present and Future
When you look at KO as it sits today, we find that its stock price has twice reverted to the mean, or came into value (touch the orange line). However, since June of 2010 it once again appears to be approaching a rich valuation. On the other hand, today’s valuation is nothing like it was during the irrational exuberant period described above. Suffice it to say that we don’t believe that Coca-Cola represents a bargain at today’s levels.
Conclusions
I hope the reader considers that the intention of this article was not to dish Warren Buffett or to challenge his investing acumen. Quite the contrary; I am a long-term admirer of this legendary value investor. Perhaps I will admit to being a little jealous of his ability to hold a position like Coca-Cola even when it was so overvalued. I don’t believe my clients would have been able to muster that much patience. So I guess you could say that I also admire the relationship he has forged with his loyal client base. Furthermore, I also understand that Coca-Cola was only a small portion of his overall portfolio, and that the dividend income he received from his holdings was able to fund additional attractive investments.
The main reasons I authored this piece was to illustrate the importance of sound valuation. Even the best of companies, and Coca-Cola certainly fits that category, can become dangerously overvalued when markets are behaving irrationally. Additionally, I hope this piece brought some insight into the importance of earnings and dividends as they apply to investment results. The markets may not always be rational, but if we understand sound value investing principles, we can behave rationally regardless of what the market is doing.
Disclaimer: The opinions in this document are for informational and educational purposes only and should not be construed as a recommendation to buy or sell the stocks mentioned or to solicit transactions or clients. Past performance of the companies discussed may not continue and the companies may not achieve the earnings growth as predicted. The information in this document is believed to be accurate, but under no circumstances should a person act upon the information contained within. We do not recommend that anyone act upon any investment information without first consulting an investment advisor as to the suitability of such investments for his specific situation.