Forecasting Calculators
All Subscribers (Premium and Basic) have access to five separate color-coded and distinct calculators as follows:
Estimates Calculator
The first forecasting calculator titled “Estimates” (dark brown graph) will be the default calculator that will automatically show each time a graph is produced. This is presented as the default calculator on the basis that near-term analyst estimates are more likely to be accurate than farther out estimates. This graph will show 2-3 years of forward analyst estimates depending on two primary factors. First of all, each company’s fiscal year-end will determine whether two or three forward years of analyst estimates are included. Second, we will only include estimates when a credible number of analysts are reporting (2 or more). Note: when there are no estimates available for a company, subscribers will be alerted and directed to utilize either the “Historical CAGR” or the “Custom” forecast calculator options which will be described later.

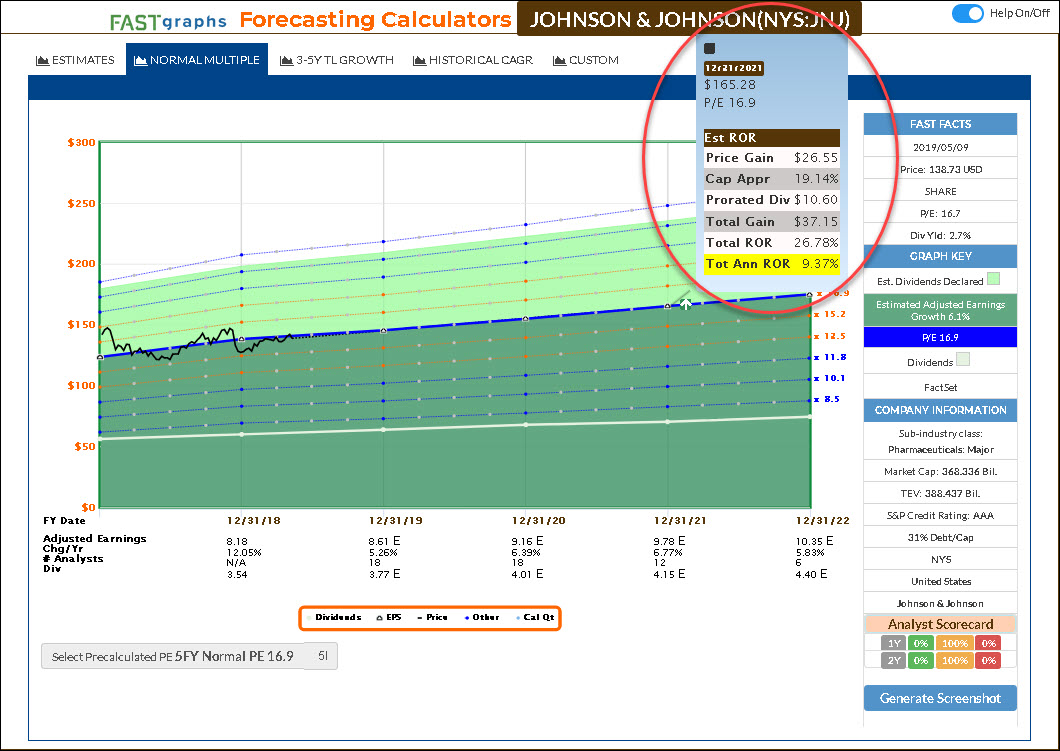
Normal Multiple Calculator
The second forecasting calculator option titled “Normal Multiple” (dark blue graph) will produce the same consensus estimates as the “Estimates” graph, however, the primary valuation reference line will be based on the company’s calculated historical normal P/E ratios. This calculator option provides a drop-down window where the subscriber can choose normal P/E ratios over different historical timeframes. Therefore, subscribers can utilize the historical normal P/E ratios of their choice, or those that they are most comfortable with. Note: these historical normal P/E ratios will differ slightly from what is seen when the historical earnings and price correlated graph is drawn because they do not include estimate data in the calculations. However, the differences will for the most part be minor and/or immaterial.

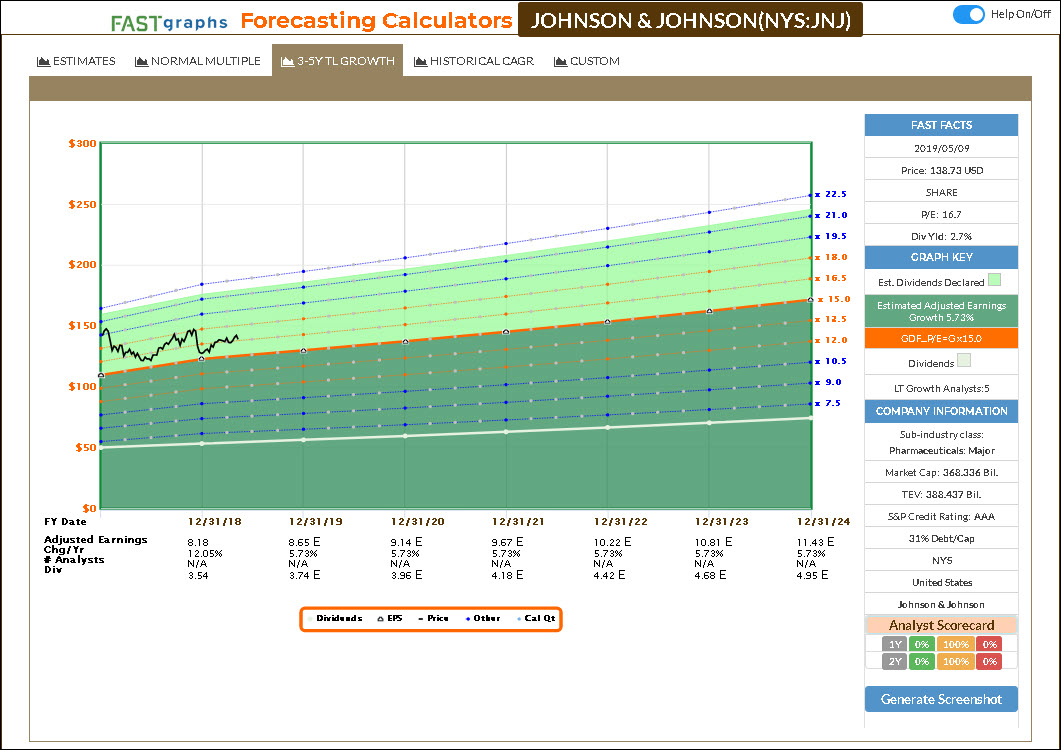
3-5Y TL Growth Calculator
The third forecasting calculator option is titled “3-5Y TL Growth” (light brown graph) and provides a simple trend-line (TL) estimate of earnings growth based on consensus 3-5 year long-term growth rate estimates of analysts reporting to FactSet. Consequently, this graph is most useful when evaluating earnings estimates based on a long-term growth rate trend. Therefore, the focus should be primarily on the last couple of years of estimates on the graph, as the near-term estimates will differ from the specific near-term estimates provided on the “Estimates” and/or “Normal PE” earnings calculator options. In other words, this calculator option is offered as a long-term earnings growth perspective for those subscribers interested in a longer-term view.
Historical CAGR Calculator
The fourth forecasting calculator option is titled “Historical CAGR” (green graph) and generates earnings forecasts based on a company’s historical, compound annual earnings growth rate (CAGR) achievements. Utilizing a company’s historical growth rate as a forecasting option is favored by many analysts and investors. This forecasting calculator also includes a drop-down window that allows you to select precalculated growth rates over various timeframes of the subscriber’s choice. Note: these historical growth rate achievements will differ slightly from what is seen when the historical earnings and price correlated graph is drawn because they do not include estimate data in the calculations. However, the differences will for the most part be minor and/or immaterial.

Custom Calculator
The fifth and final calculator option is titled “Custom” (red graph) and allows the subscriber the ability to create their own forecast calculations. There are multiple customization options available with the Custom graph. Subscribers can input and utilize any P/E ratio of their choice to create the primary valuation reference line. Additionally, subscribers can input their own earnings and/or dividend expectations for each specific future year, and provide any growth rate that they consider appropriate. Note: in order to initially draw a complete graph this graph defaults to the same estimates presented in the “3-5 Y TL” graph. However, subscribers are free to customize the graph according to their own calculations or views.

Dynamic Rate of Return Calculations and Functionality
An important and powerful feature of all five forecast calculators are dynamic future rate of return calculations and the presentation of important metrics. When the subscriber points to any of the dots or triangles on the calculator, a pop-up with calculations and data points will appear. If the subscriber double clicks any of the dots or triangles, a dotted line from Point A to Point B will appear and remain until it is clicked off. Additionally, a color-coded arrow will appear indicating gain (green/white arrow) or loss (red/white arrow).
In addition to providing important return calculations and other metrics to include the date, price and the representative P/E ratio, these pop-ups will remain on the graph allowing the subscriber to toggle between one calculator to the next without the pop-up closing. This empowers the subscriber more efficiency with their thinking processes as they evaluate estimate calculation options. To remove the pop-ups, simply click the selected dot or triangle. Also, if the dots or triangles are not double clicked, they will automatically disappear as you move your cursor from one point to the next.
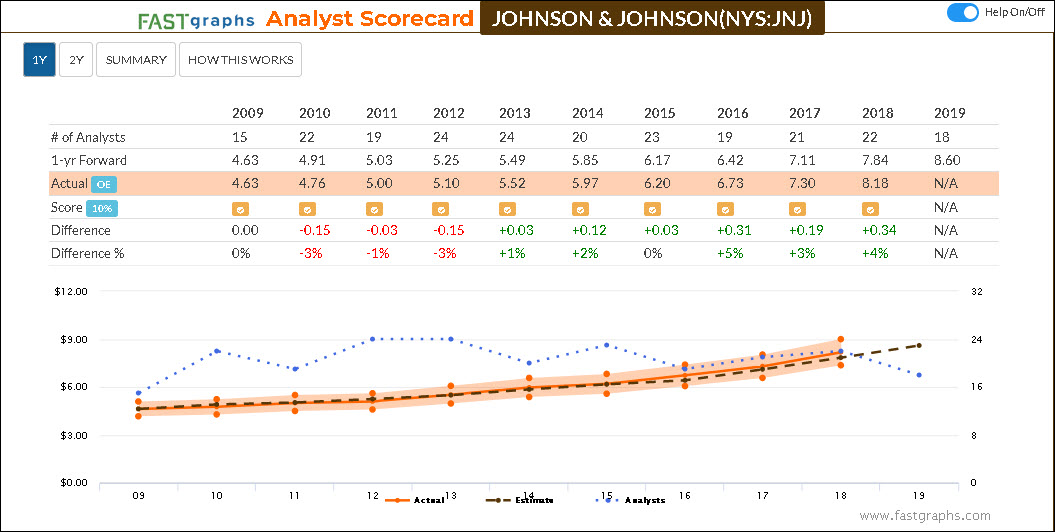
Analyst Scorecard
In addition to our forecasting arsenal is the “Analyst Scorecard” that relates to the first two calculator options, the “Estimates” calculator and the “Normal Multiple” calculator.
Since the estimates on these first two calculators are based on specific one year forward and two year forward consensus analyst estimates, the Analyst Scorecard provides subscribers a perspective on how accurate the analysts have been with those specific estimates in the past. The scorecard is intended to give subscribers a perspective on how reliable the forecasts were for any given company based on the analysts’ past records. In other words, it provides another thinking point on the F.A.S.T. Graphs powerful “tool to think with.”
There are three options that the subscriber can review and choose by clicking on the tabs at the top of the Analyst Scorecard. The 1Y (one year forward) scorecard calculates previous analyst accuracy within a reasonable 10% margin of error. The 2Y (two year forward) scorecard calculates previous analyst accuracy within a 20% margin of error. The scores are presented in both tabular and graphic form. Note: The Analyst Scorecard is also built with dynamic features that allow subscribers to remove items from the graphic for simplicity and convenience. If you click on any of the words in the legend at the bottom (Actual, Estimate, Analysts) the lines and/or shadings on the graph will be removed. To bring them back, simply click on the words in the legend again.
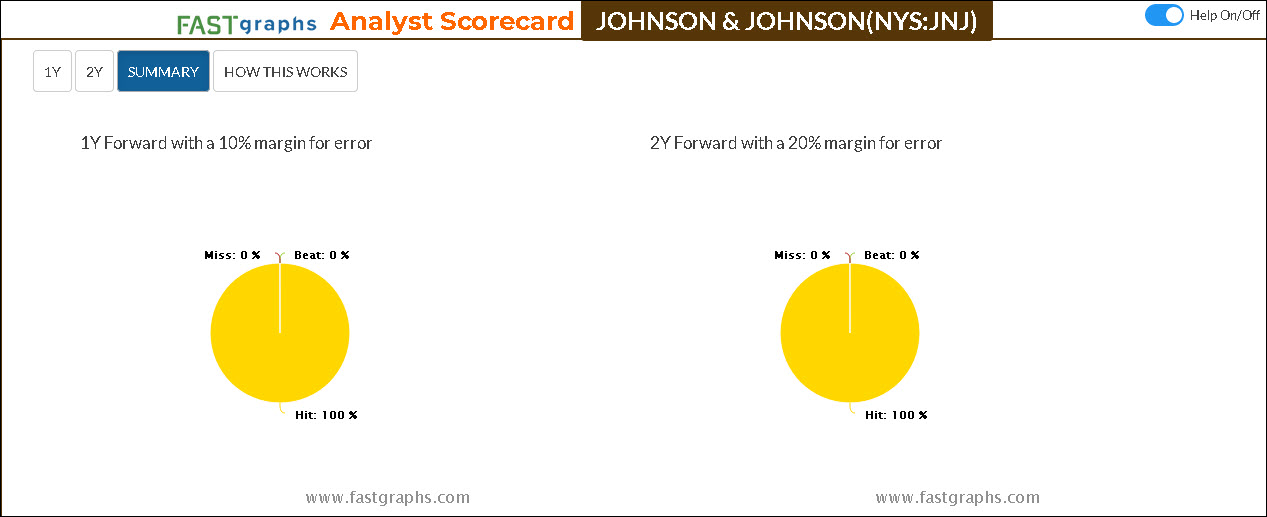
The “Summary” option produces a simple graphical expression of analyst accuracy for both the one-year (1Y) and two-year (2Y) previous forecasts. And finally, there is a tab titled “? How This Works” that provides a brief explanation of the scorecard and scores.
Here is a link to FAST Graphs Forecasting – What it is and How it Works:
https://fastgraphs.com/wp/fast-graphs-forecasting-what-it-is-and-how-it-works/