FUN is an acronym for Financial Underlying Numbers. FUN Graphs are designed to empower premium subscribers the capability to quickly and efficiently engage in a comprehensive and deep dive into each company’s historical fundamental results. There are 4 separate but comprehensive and powerful FUN graphing options available to premium subscribers. Each of these graphing options provides historical data going back approximately 20 years (if available) to include a quarterly data option for the past 8 or 9 quarters.
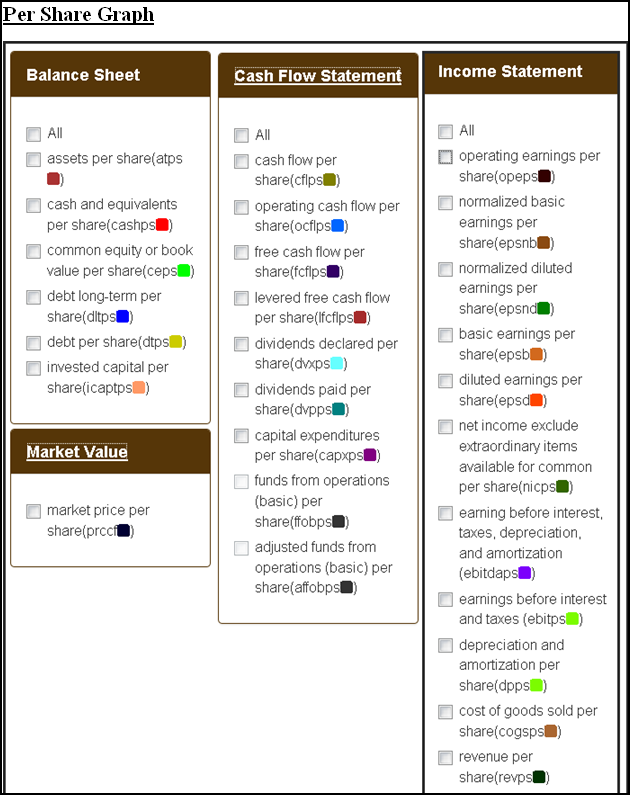
- The “Per Share Graph” empowers premium subscribers to F.A.S.T. Graphs™ the capacity to review a company’s balance sheet, cash flow statement or income statements on a per-share basis annually.
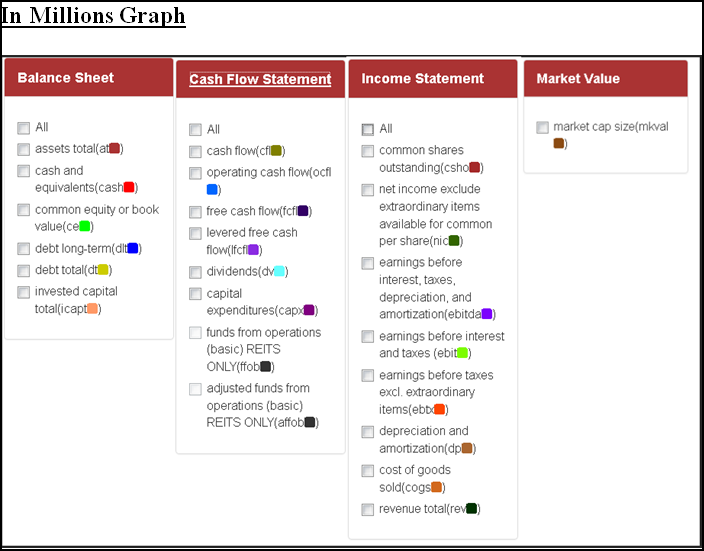
- The “In Millions Graph” provides the same balance sheet, cash flow statement and income statement data but it is reported in millions of dollars instead of on a per-share basis. Although this graph covers essentially the same financial data as the “Per Share Graphs” it includes the additional metric of common shares outstanding. This allows premium subscribers to evaluate the effects of a company share buyback history.
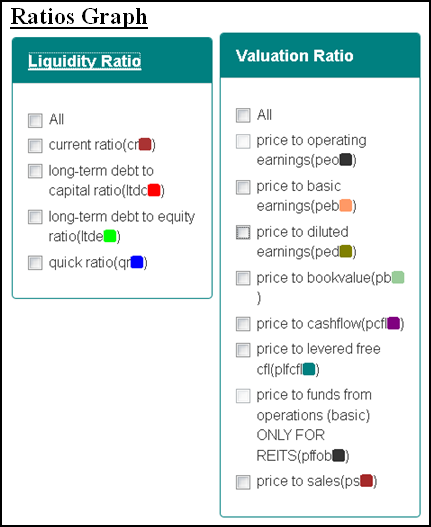
- The “Ratios Graph” provides up to 20 years of key liquidity ratio data such as the current ratio, quick ratio and long-term debt to capital and equity. Premium subscribers are also provided numerous valuation ratios to include price to book value, price to cash flow and several others. The ability to compare historical ratios to current ratios allows you to evaluate whether these important metrics are improving or weakening.
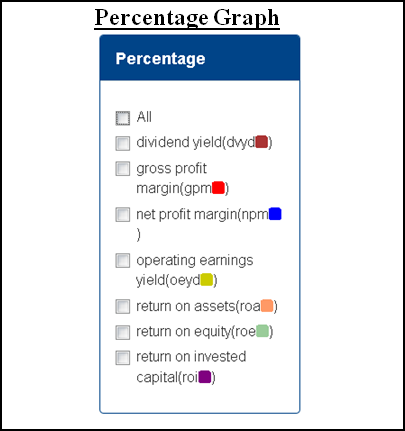
- The “Percentage Graph” provides important metrics such as gross and net profit margin, return on assets, equity and capital. These are important metrics to evaluate how efficiently the business is being managed and/or has operated over time, and quickly determine if these important metrics are improving or weakening.
FUN Graphs provide premium subscribers the ability to evaluate all these important metrics quickly and easily. Without FUN Graphs it would take hundreds of hours of tedious work examining individual financial statements to get what FUN Graphs can reveal in an instant. Consequently, premium subscribers to F.A.S.T. Graphs™ can research stocks deeper and faster.
Below are screenshots of all the fundamental metrics: