VF Corporation (VFC) is the world’s largest apparel company with solid brands that are sold in more than 150 countries throughout the world. The company traces its roots back to 1899 when eight men formed the Reading Glove and Mitten manufacturing company in Reading, Pennsylvania. In 1911 one of the eight men, John Barbey, bought out his partners and changes the company’s name to Schuylkill Silk Mills in 1913. In 1919 the company changed its name once again to Vanity Fair Silk Mills, Inc. In 1951 Vanity Fair Mills goes public.
After making a slew of new acquisitions throughout the 1990s, VF Corporation launched a major restructuring in 2001. Faced with a maturing product line in the United States , VF Corporation continued to acquire vibrant brands while simultaneously divesting mature brands. In 2007, VF Corporation sold its once namesake Vanity Fair intimate apparel business to Fruit of the Loom. Today VF Corporation markets over 30 industry-leading brands through a powerful and extensive worldwide distribution network.
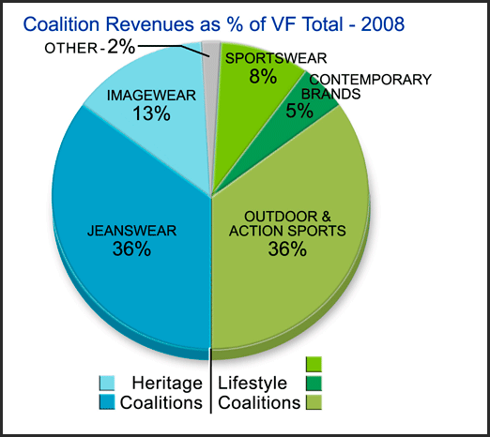
VF Corporation’s brands are segmented into five coalitions as follows:
1. Jeanswear
2. VF Imagewear
3. Outdoor
4. Sportswear
5. Contemporary

According to Morningstar analyst Peter Wahlstrom, CFA, in his analyst note dated 7/22/2010:
VF’s brand success, in our opinion, is supported through its operational structure, which allows individual brands to function independently and pursue separate growth initiatives while leveraging centralized procurement, information technology, and logistics. The firm operates more than 30 manufacturing sites and 30 distribution centers, and each year ships more than 400 million units, across 30 brands, to its customers. Over the last five years alone, VF’s gross margins have expanded by 300 basis points. We expect the firm’s scale, and expansive sourcing and distribution capabilities to drive efficiency gains, offset pressure from mass merchandisers such as Wal-Mart (WMT), and support future revenue growth.
Unique Organizational Structure
We believe that VF Corporation is a well-positioned global apparel powerhouse. The company believes that their unique organizational structure is the key to their strength. Their coalitions are organized into two groups: Heritage and Lifestyle.
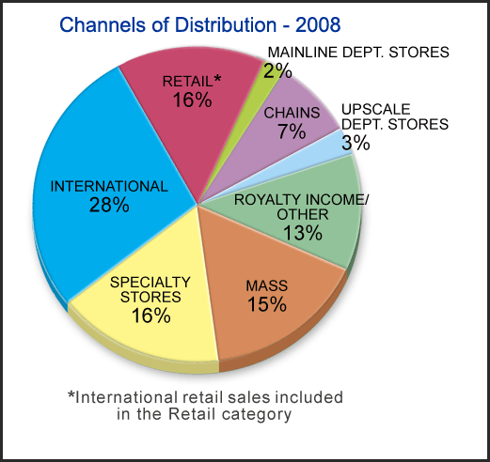
According to VF Corporation, these coalitions provide a balanced base of business across multiple channels of distribution.
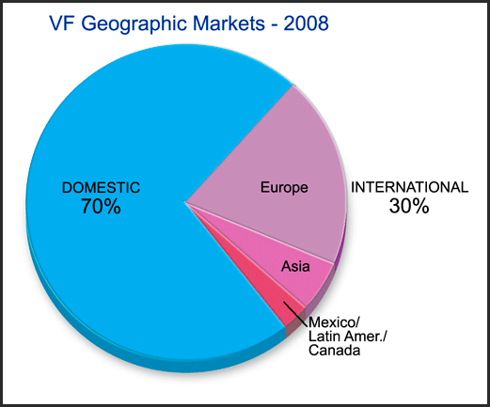
And a balanced base of business across many different geographic markets.
Fundamentals-at-a-glance
VF Corporation has a long history of profitable growth, and has increased its dividend every year for over 35 years running. Nevertheless, the market has historically priced VF Corporation at a price earnings ratio below its earnings justified value based on our GDF- EDMP formula for calculating intrinsic value. Therefore, we feel that VF Corporation should only be considered for investment when its P/E ratio is 13 or less. In our opinion, the weakness in the stock market over the last couple of months has brought VF Corporation shares into value.
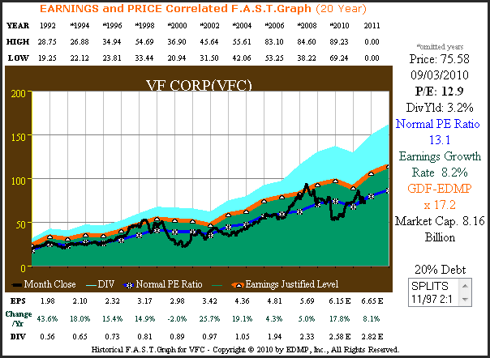
Figure 1A below looks at VF Corporation through the lens of our EDMP F.A.S.T. Graphs™ since 1992. VF Corporation has grown earnings at a compound average rate of 8.2%. The orange line with white triangles represents a P/E ratio of 17.2 times earnings, our fair value calculated P/E ratio for a company growing at this rate. The blue line with asterisks on Figure 1A represents the calculated normal P/E ratio of 13.1 that the market has historically priced VF Corporation shares at. From this graph it should be clear that VF Corporation has historically been a reasonable purchase at or below 13 times earnings.
Figure 1A 20yr. EPS Growth Correlated to Price
(VFC) 20yr. EPS Growth Correlated to Price
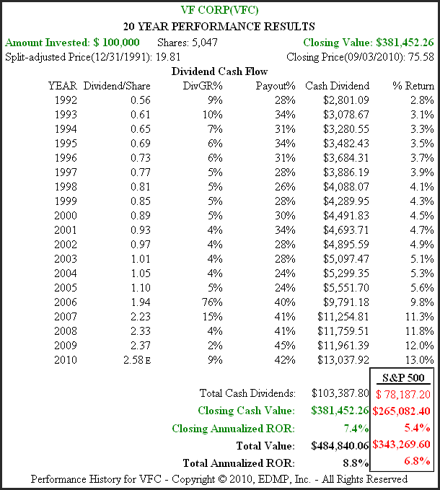
Figure 1B below calculates the performance associated with Figure 1A. In addition to providing their shareholders with capital appreciation greater than the S&P 500, VF Corporation has also provided a strong dividend component. Note from the dividend cash flow table the strong impact that an increase in their payout ratio in 2006 had on shareholder dividends.
Figure 1B 20yr. Performance History
(VFC) 20yr. Performance History
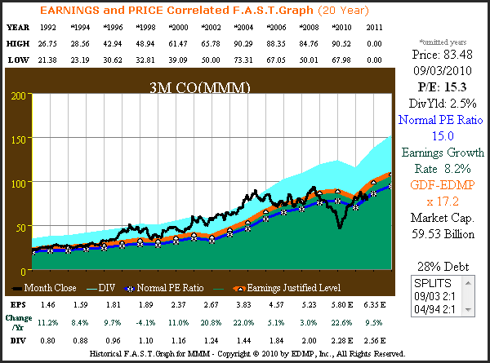
For perspective and contrast we offer Figures 2A and 2B below on 3M Company (MMM) since 1992. 3M Company has grown their earnings at a compounded rate of 8.2%, precisely the same rate as VF Corporation achieved. Yet, a visual review of our EDMP F.A.S.T. Graph™ on 3M Company illustrates that the market has historically valued 3M Company’s shares at a higher P/E ratio than it has VF Corporation even though operating results have essentially been the same.
Apparently, the “market” values an industrial conglomerate more richly than it does an apparel company. However, we wager that a dollar’s worth of dividends from either company would spend the same. We think this is important information for prospective investors to consider before investing. In our opinion, it’s more important to know that this is true, then to know why it’s true. One can only speculate on the market’s reasoning, but the numbers speak for themselves.
Figure 2A 20yr. EPS Growth Correlated to Price
(MMM) 20yr. EPS Growth Correlated to Price
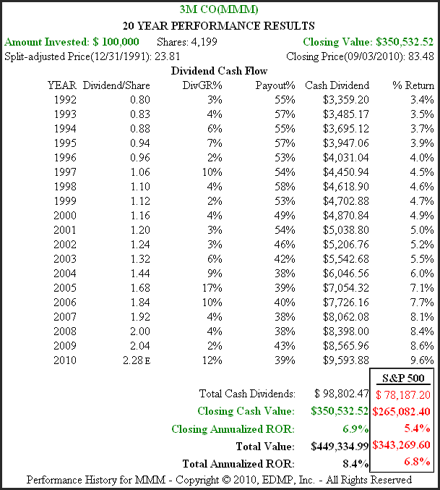
Figure 2B calculates the performance associated with Figure 2A. Note the correlation between earnings growth, total return and dividend income. The same correlation applies to VF Corporation Figures 1A and 1B above.
Figure 2B 20yr. Performance History
(MMM)20yr. Performance History”
A few words on the F.A.S.T. Graphs™
Before we continue with our analysis of VF Corporation we would like to offer a few words about interpreting the F.A.S.T. Graphs™. The F.A.S.T. Graphs™ software correlates stock prices to earnings growth. Unlike most charts that deal only with stock price, the F.A.S.T. Graphs™ offer the additional perspective of important fundamentals-at-a-glance.
Also, unlike other charting tools, the F.A.S.T. Graph™ does not boast to predicting stock price. Instead, it is offered as a tool to aid investors in making sound investment decisions based on fundamental values.
The orange line with white triangles represents the earnings justified value based on accepted formulas for valuing a business. The green shaded area represents the company’s earnings with the earnings growth rate number marked in the same green color ink to the right.
The blue shaded area represents dividends paid out of the green earnings and placed on top for visual perspective. The blue line with asterisks represents a calculated normal P/E ratio the market has historically applied to the respective company, and the PE ratio number is printed in the same blue color ink to right. The black line is monthly closing stock prices.
The implied, and-oversimplified interpretation, would be as follows: When the black price line is above the orange line the stock is overvalued, when it touches the orange line it is fairly valued, and when it is below the orange line the stock is undervalued.
As a cautionary statement, it is up to the user to apply this information regarding their own risk tolerances and investing strategies. Like any tool, its value is directly proportionate to the skill of the user.
VF Corporation – Focused on Shareholders
VF Corporation has a legacy of being a shareholder friendly corporation. Recently, they strengthened their commitment to shareholders with the introduction of the concept “total shareholder return.” The two primary components of this concept are increasing share price and dividends. Management states that the drivers to accomplishing these goals include strong top line growth, strong gross margins and lower expense levels; all elements that strengthen the P&L. Currently, every decision management makes at VF Corporation is run through their formula for TSR (total shareholder return).
Growth Drivers
Starting in calendar year 2004, VF Corporation’s management has committed the company to an ambitious growth plan. Their objective is to transform VF into a global lifestyle apparel company. To accomplish this they identified six growth drivers that they believe are crucial to their success:
1. Build more global, growing, lifestyle brands. 2. Expand our share with winning customers. 3. Stretch our brands to new geographies. 4. Expand our direct-to-customer business. 5. Fuel the growth. 6. Build new growth enablers.
In January 2008 they updated their growth plan reflecting confidence in their future. Management established a long-term revenue growth target of 8% to 10%. They intend to fuel this growth organically and with acquisitions. In line with their revenue growth targets, are earnings per share growth of 10% to 11% and the commitment to a dividend payout ratio of 40%. Additionally, management has targeted achieving an operating margin of 15%, international revenues to reach a third of total revenues by 2012 and direct to consumer business equaling 22% of total revenues, all culminating to $11 billion in total revenues.
Conclusions
After posting very strong second quarter results, VF Corporation appears to be on track towards meeting management’s ambitious growth objectives. According to Zacks Investment Research:
The company’s policy to acquire businesses with global growth opportunities and exiting businesses with less potential, has transformed VF, creating a strategic balance that drives growth and profit improvement. In 2009, VF generated approximately $3.9 billion in revenue from brands acquired over the past decade.
VF Corporation currently trades at a P/E ratio of 12.9, and offers an entry dividend yield of 3.2%. We believe that VF Corporation possesses a strong and shareholder friendly management team. The company’s balance sheet is very strong and they generate strong cash flows that support future acquisitions, share buybacks and most importantly a potentially increasing dividend income stream. Therefore, conservative investors seeking quality, growth, sound valuation and a growing dividend should take a closer look at VF Corporation.
Disclaimer: The opinions in this document are for informational and educational purposes only and should not be construed as a recommendation to buy or sell the stocks mentioned or to solicit transactions or clients. Past performance of the companies discussed may not continue and the companies may not achieve the earnings growth as predicted. The information in this document is believed to be accurate, but under no circumstances should a person act upon the information contained within. We do not recommend that anyone act upon any investment information without first consulting an investment advisor as to the suitability of such investments for his specific situation.