Introduction
The 5 Forecasting Calculators are found under the Forecasting tab. These are used to perform performance calculations using the estimates provided. Each Calculator has 11 different valuation lines with clickable points for each of the four quarters in the fiscal year.
The Estimates Forecasting Calculator is the default calculator when going to the Forecasting tab. This can show up to 3 years of estimates and are the same estimates found on the Historical Graph.
There are five sets of calculators, the first two are based on specific consensus analyst estimates 1 to 3 years forward depending on the company and how many analysts are following it. These specific estimates and the number of analysts come directly from S&P Capital IQ.
The third calculator is driven from an additional long-term (3 to 5 year) growth rate estimate. This is actually a different estimate that applies to the longer-term. The F.A.S.T. Graphs™ calculator where these long-term estimates apply is the “3-5Y TL Growth” calculator. It is solely based on the long-term growth rate and is drawn as a trend line (TL indicates trend line).
With this calculator, the near-term estimates should be ignored and only the last year or two’s numbers should be evaluated. The reason for this is because earnings growth is simply extrapolated out based on the 3 to 5 year growth rate separate estimate described above. The final two calculators are not specifically based on estimates. One of them allows you to input various historical growth rates as a proxy for estimates, and the final calculator is a custom calculator that allows you to put in your own inputs.
This is a link found under “Documentation” that explains the Forecasting Calculators in detail.
The 5 Forecasting Calculators include:
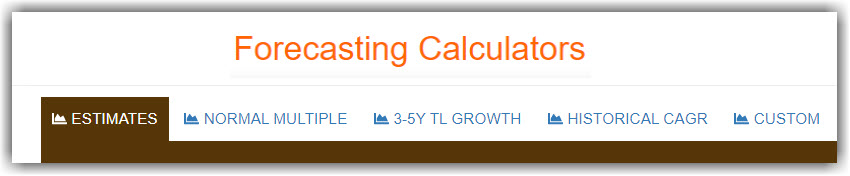
FAST Graphs Analyze Out Loud Reviewing the Forecasting Tool powered by FAST Graphs.
Try FAST Graphs for FREE Today!