In this, our 12th and final installment of our series of articles on when and why to buy a stock, we will focus on how to use the principles of valuation to avoid obvious mistakes. As mentioned in previous articles, investing is never a game of perfect. The best that an investor can hope for is to make sound long-term decisions, with the majority of them working out to their benefit in the end.
However, investing is a very complex endeavor, and mistakes are inevitable. Therefore, it’s imperative that the obvious mistakes which can and should be avoided are avoided.
Obviously, mistakes usually occur when the market or people are caught up in emotion. As we all know, the primary emotional responses that can affect investor behavior are fear and greed. When gripped by the hype from greed or by the hysteria from fear, investors rarely behave rationally. It is during times like these when stock prices can become disconnected from True Worth™ valuations. This undeniable fact that stock values are not always rational needs to be recognized and accepted.
In our opinion, one of the primary reasons why investors often make bad investment decisions is because their judgment is usually based only on price movement. As we will illustrate, price movements alone can be very misleading. A rising stock price will often lull an investor to sleep creating a false sense of security where they believe that all is well.
On the other hand, a falling stock price usually creates anxiety and sometimes leads to outright panic. These feelings can be rational as long as they are justified by sound fundamentals. Knowing the differences between rational and emotional reactions will make all the difference, as the following examples will illustrate.
When General Electric’s Stock was an Obvious Mistake
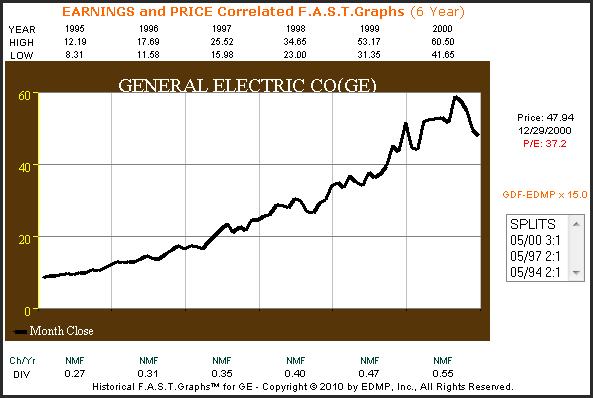
To illuminate these points, let’s look back in time at General Electric Co. (GE), a highly regarded blue-chip. The following F.A.S.T. Graphs™ plot General Electric’s stock price during the infamous irrational exuberant timeframe 1995 to 2000. For the better part of six straight years, General Electric’s stock price steadily advanced.
These were the final years of the Jack Welch era, and shareholders were in investing bliss, loving both the company and the stock. From the following price chart, it’s easy to see why no one saw or even sensed any danger.
General Electric 6-year earnings and price correlated F.A.S.T. Graphs™
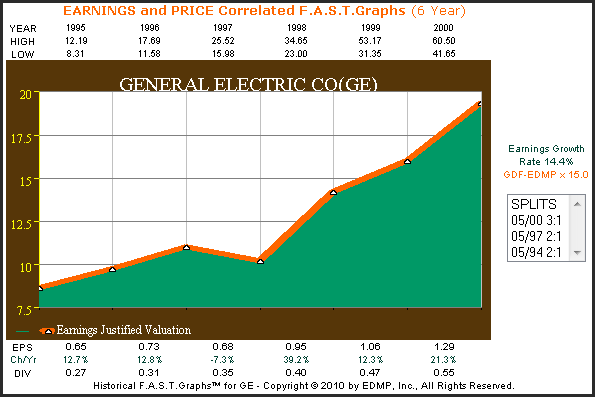
With our next F.A.S.T. Graphs™, let’s look at General Electric from the perspective of earnings growth only, over the exact same 1995 to 2000 timeframe. With this isolated perspective, we again find little for investors to worry about. There was a slight earnings hiccup in 1997, however, earnings growth of over 39% in 1998 more than made up for 1997’s modest 7% drop.
For the six-year period, General Electric’s earnings growth rate was 14.4%. This is in contrast to the earnings growth rate for the S&P 500 of 9.5%. Therefore, since fundamentals were strong, General Electric’s stock price advance appeared to make sense.
General Electric 6-year earnings and price correlated F.A.S.T. Graphs™
Imminent Danger when Price and Earnings are Plotted Together
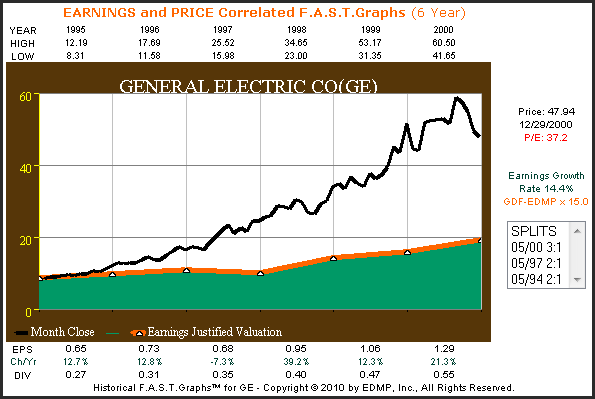
There is no sign of impending danger or risk until you look at General Electric’s stock price correlated to its earnings growth. However, from the F.A.S.T. Graphs™ below, where stock price is overlaid with the earnings justified valuation line (orange line with white triangles), a clear picture of significant overvaluation becomes very evident.
In the first year 1995, price and earnings were tracking nicely. However, starting in 1996 the gap between stock price and earnings based intrinsic value began to steadily widen. Also, notice that calendar year 2000 was the only year in this series where stock price ended lower than where it began, indicating the first signs of risk.
General Electric 6-year earnings and price correlated F.A.S.T. Graphs™
Overvaluation Risk – a Picture Worth 1000 Words
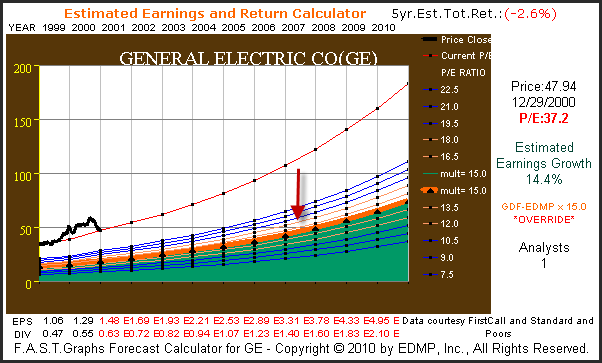
At its peak in calendar year 2000, General Electric Co.’s P/E ratio was approximately 47, and by year-end it had fallen to 37.2. If investors would have taken the time to run the numbers, they would have quickly discovered how significantly overvalued this blue-chip company was, even with optimistic future earnings growth expectations.
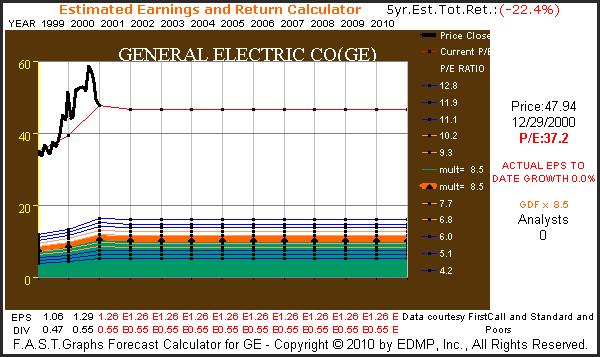
The following hypothetical F.A.S.T. Graphs™ assume that General Electric Co. would continue to grow earnings at the same 14.4% rate that it had since 1995. This graph depicts that General Electric’s stock price would not be justified by earnings until the middle of calendar year 2006 (see red arrow). Therefore, even this aggressive hypothetical forecast indicates that General Electric’s stock price is greatly overvalued.
General Electric F.A.S.T. Graphs™ Forecast
Overvaluation Risk by the Numbers
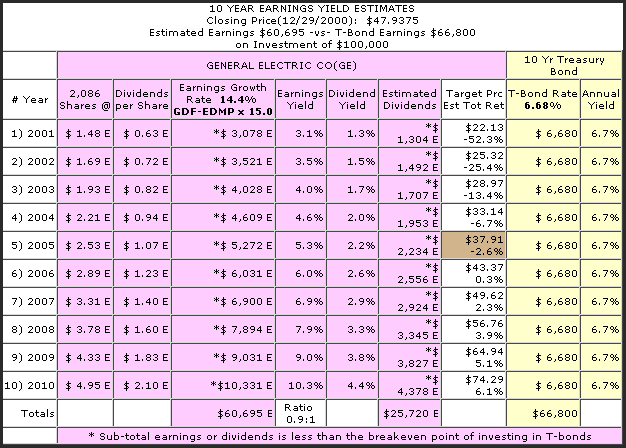
The following EYE (Earnings Yield Estimator) F.A.S.T. Graphs™ calculates the total cumulative stream of earnings that General Electric would produce on a $100,000 investment based on a hypothetical 14.4% aggressive earnings growth estimate up through 2010. Then, the EYE (Earnings Yield Estimator) F.A.S.T. Graphs™ compares this hypothetical stream of earnings to an equivalent investment in a 10 year treasury bond which would have been yielding 6.68% at that time. What should be gleaned from this analysis is the reality that even at these very aggressive hypothetical earnings forecasts, General Electric’s total cumulative earnings of $60,695 from 2001 through 2010 is less than what a riskless treasury bond would have paid.
Furthermore, keep in mind that assuming that dividends grew in line with earnings, total dividend income would have only amounted to $25,720. The same investment in the fully guaranteed treasury bond would have thrown off $66,800 worth of riskless interest. Even though General Electric is considered a high-quality blue-chip, owning this stock is much riskier than owning a treasury bond.
Therefore, since a treasury bond was throwing off more than twice as much cash (interest versus GE’s dividend) and the total cash from the treasure bond was more than General Electric’s cumulative earnings, the risk would have been obvious to anyone that had run the numbers. This is why we programmed our F.A.S.T. Graphs™ research tool to automatically do these calculations.
General Electric’s Actual Earnings Growth Since 1999
As we all know, hindsight is 20/20. The following estimated earnings and return calculator F.A.S.T. Graphs™ shows that in truth General Electric Co. has experienced zero earnings growth since calendar year 2000. Therefore, the assumption that General Electric’s earnings would continue to grow at 14.4% per annum that we used in the previous hypothetical example was considerably more than just being optimistic. With the price earnings ratio at 37.2 at year-end 2000 extreme risk was clearly evident.
General Electric F.A.S.T. Graphs™ Forecast
General Electric’s Actual Overvaluation in 2000 by the Numbers
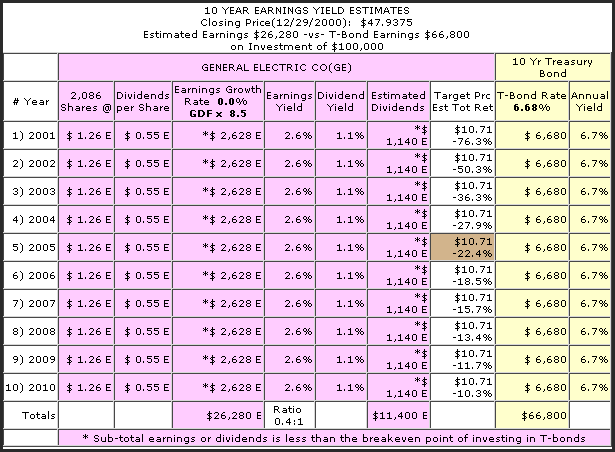
The following earnings yield estimator (EYE) F.A.S.T. Graphs™ illustrates, by the numbers, just how truly overvalued this blue-chip was in 2000. In actuality, the 10 year treasury bond would have generated more than twice as much riskless interest as the total cumulative earnings on an equal investment in General Electric’s common stock. The point being, that mathematically the valuation on General Electric’s common stock at year-end 2000 made no economic sense. Fundamental value simply did not exist.
The Inevitable Result of Overvaluation
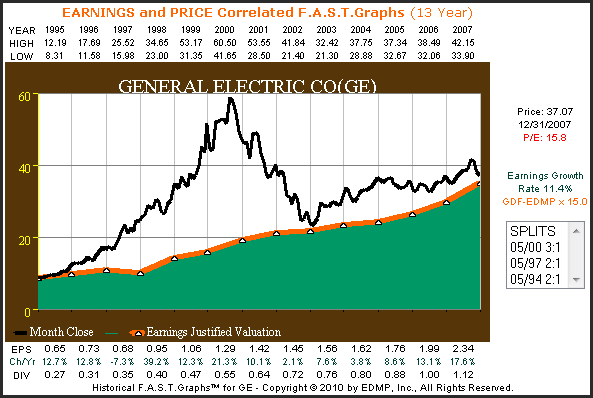
The following F.A.S.T. Graphs™ shows the actual collapse of General Electric’s stock price from a high of $60.50 at its peak in 2002 to a low of $21.30 at the beginning of 2003. We believe that this reflects a clear example of an obvious mistake that investors were making during the irrationally exuberant period which ended in 2000.
Since stock price movement, looked at independently, was quite good, and so were fundamentals, it is easy to see how investors overlooked the imminent danger. It wasn’t until the two were looked at together, providing the perspective of True Worth™ valuation, that danger revealed itself.
General Electric 13-year earnings and price correlated F.A.S.T. Graphs™
General Electric – a Valuation History Lesson
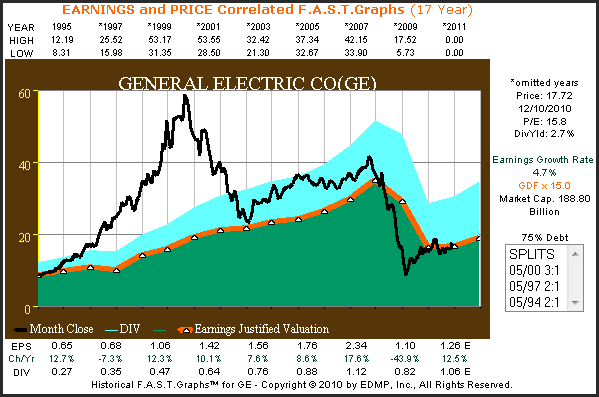
The following earnings and price correlated F.A.S.T. Graphs™ and the accompanying performance calculations on General Electric Co. with dividends added (light blue shaded area) provide a quintessential example of the importance of valuation based on earnings. There are two periods of extreme price collapses, one starting in calendar year 2000 and the other starting in 2008.
However, the root cause of each collapse was based on entirely different circumstances. In 2000, price fell strictly due to excessive overvaluation. In contrast, the price collapse of 2008 was based on fair valuation preceding a collapse in earnings. In other words, price followed deteriorating earnings. Notice that dividends were not affected when stock price was merely overvalued, but they were cut by over 34% (2009) during the recessionary stress on earnings.
General Electric 17-year earnings and price correlated F.A.S.T. Graphs™
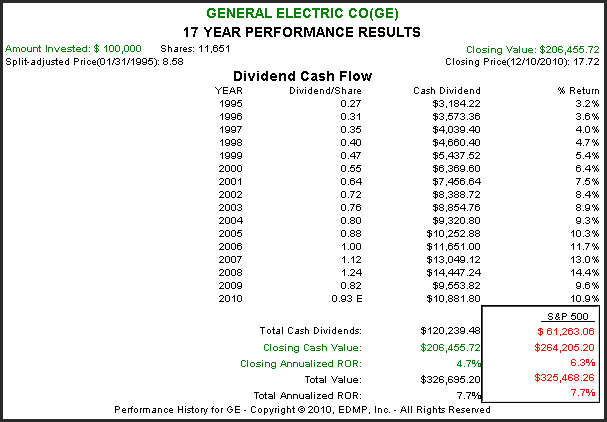
General Electric 17-year Performance Results

United Technologies Corp. Experiencing Sound Valuation
The following F.A.S.T. Graphs™ and accompanying performance results on United Technologies Corp. (UTX) are offered as a contrast where valuations make sense. United Technologies Corp. is a close competitor of General Electric’s in many areas. However, for whatever reasons, United Technologies Corp.’s stock price never got too out of whack from their earnings justified levels.
There were a few times when price rose modestly above the earnings justified levels, but never to the obvious extent seen with General Electric during the irrationally exuberant period. Consequently, note how much more consistent and higher United Technologies’ shareholder returns were as a result.
United Technologies Corp. 17-year earnings and price correlated F.A.S.T. Graphs™

United Technologies 17-year Performance Results
Is Salesforce.Com Inc. an Obvious Mistake?
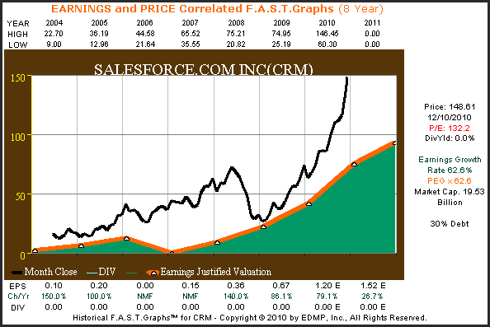
The following analysis of Salesforce.Com Inc. (CRM) through the lens of our F.A.S.T. Graphs™ (Fundamentals Analyzer Software Tool) evaluates this highflyer by the numbers, as they sit today. Our price and earnings correlated F.A.S.T. Graphs™ on Salesforce.Com Inc. since they went public in June of 2004, shows an extremely powerful earnings growth rate of 62.6%. However, the current price earnings ratio of 132 visually appears extreme.
Salesforce.Com Inc. 8-year earnings and price correlated F.A.S.T. Graphs™
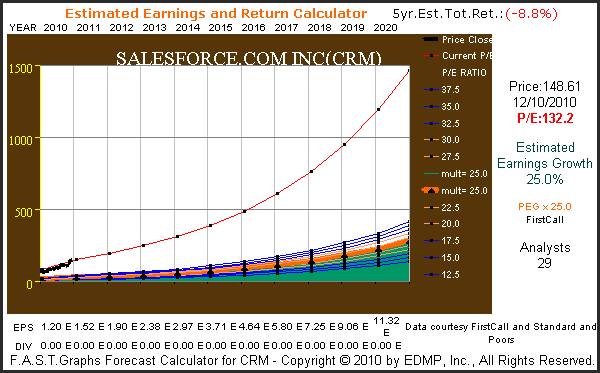
Since we cannot buy the past, but only invest for the future, let’s look at what earnings growth expectations are for Salesforce.Com Inc. based on the consensus of 29 leading analysts reporting to FirstCall. The estimated five-year growth rate from these analysts is pegged at a very strong 25% per annum. This is a high rate of growth for a company whose market cap is already in excess of $19 billion. Nevertheless, the rational investor should ask: Would this rate of growth justify today’s valuation?
Additionally, we have optimistically expanded the current high analyst estimates of 25% earnings growth for an additional five years to include the year 2019 so that we can compare Salesforce.Com Inc. potential cumulative future earnings to an equal investment in a 10 year treasury bond. However, as strong as these estimates are the graph below does not visually illustrate future earnings that would justify today’s lofty price.
Salesforce.com F.A.S.T. Graphs™ Forecast
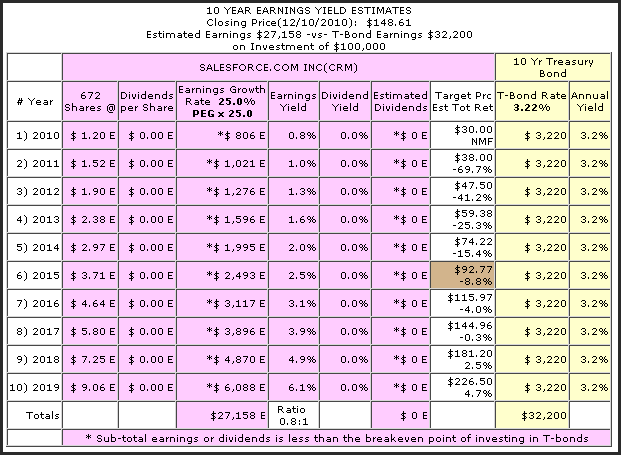
When you run the numbers that apply to the above graphs the overvaluation discrepancy should be obvious. The following F.A.S.T. Graphs™ earnings yield estimator calculates an equal investment in Salesforce.Com Inc. as compared to a 10 year treasury bond. Even when you consider today’s extremely low rate on a 10 year treasury bond, the cumulative potential earnings growth of 25% per annum for Salesforce.Com Inc. would not equal the riskless and guaranteed interest available from a 10 year treasury bond.
The important questions that an investor needs to ask is: Why take such great risk when I can get more cash flow from a theoretically riskless treasury bond? Where would the eventual payoff come from? The answers could only make sense based on the greater fool theory. This theory states that you foolishly pay more for a company than it’s worth on the basis that a fool greater than you will come along and pay you more than you foolishly paid in the first place. How else could you explain today’s valuation?
Conclusions
This article was written in order to provide a foundation of understanding of the principles behind the concept of True Worth™ valuation, also known as intrinsic value or fair value. The idea here is that there is a mathematical basis for value that is a logical function of cash flows or earnings.
In other words, since an investment derives its value from cash flows or earnings, the trick is in knowing how to value the cash flows or earnings an investment generates. The simplest way to accomplish this is to calculate the actual rate of return that the cash flows generate on a given level of investment.
After you calculate the returns that your cash flows are giving you, then it’s only logical to compare those returns to what you can earn from a so-called riskless instrument like a treasury bond. If the cash flows you are earning from your risk investment (example a stock) are not significantly greater than what you could earn from a riskless investment like a treasury bond, then you should immediately recognize that something is terribly wrong.
Why take high risk for lesser return, it simply does not make any sense. However, the only way to know that is to run the numbers and do the calculations. The F.A.S.T. Graphs™ research tool we utilized throughout this article automatically does the calculations and provides them in graphic form. From these “fundamentals at a glance” graphs, any valuations that are out of whack become readily apparent.
In the article we only provided one example of dramatic overvaluation (General Electric Co.) during the irrationally exuberant period 1995 to 2000. However, there were numerous other examples we could have provided.
Almost every publicly traded tech stock was overvalued during this time to include: Cisco (CSCO), Oracle (ORCL), EMC (EMC), Intel (INTC), Microsoft (MSFT) and many others. Additionally, blue chips like Wal-Mart (WMT), Coca-Cola (KO), Colgate-Palmolive (CL) and numerous others were also overvalued to various degrees. However, investors were generally ignoring the risk because stock prices were rising.
Calculating valuation correctly is a direct function of forecasting future cash flows accurately. Logic dictates that this is a formidable task that is fraught with traps and surprises. One the other hand, logic and reason applied intelligently can be up to the task within reasonable ranges of probability.
Forecasting future income streams does not have to be done perfectly, but it does need to be done rationally. Obvious mistakes, that should be avoided, are made when there is no reasonable or rational possibility that valuations can be justified by accomplishable future growth.
Disclosure: I have no positions in any stocks mentioned, but may initiate a long position in UTX over the next 72 hours. The opinions in this document are for informational and educational purposes only and should not be construed as a recommendation to buy or sell the stocks mentioned or to solicit transactions or clients. Past performance of the companies discussed may not continue and the companies may not achieve the earnings growth as predicted. The information in this document is believed to be accurate, but under no circumstances should a person act upon the information contained within. We do not recommend that anyone act upon any investment information without first consulting an investment advisor as to the suitability of such investments for his specific situation.I have no positions in any stocks mentioned, but may initiate a long position in over the next 72 hours.