Introduction
This article will review 10 fast growing stocks that we feel are in the sweet spot for investors interested in above average total return. In order to be considered a fast-growing company, the stock has to have demonstrated a consistent rate of change of earnings growth of between 15%-25%. We consider this the sweet spot, because we believe that these rates of earnings growth are achievable over extended periods, for well-managed above average growing companies.
In our last article we looked at super-fast growth stocks, which we defined as companies growing earnings at 25% per annum or better. Companies that are growing that fast will rarely pay a dividend, because they require a significant amount of capital to fund such high growth. Therefore, there is scant capital available for them to pay dividends. However, as growth inevitably slows, many companies now in the fast growth category (15% to 25% growth) will often institute a dividend policy.
Initially, fast-growing companies that do initiate a dividend will often start out with single digit payout ratios. However, over time, as they morph from a pure growth stock into a growth and income stock, their payout ratios will tend to increase. As a result, their dividend yields will usually be lower starting out, but grow faster than a stalwart’s dividend normally would. Furthermore, if and when their growth begins to slow, their payout ratios will often increase. Therefore, what we call growth yield, and others refer to as “yield on cost”, has the potential to increase rapidly over time.
Through decades of extensive research, we have concluded that the Price Equals Growth rate or PEG ratio formula for valuing a stock works extremely well for companies that grow earnings at 15% per annum or better. Regardless of whether a company pays a dividend or not, this formula for valuing a growth stock seems to apply equally. The following five companies have historically grown earnings at 15% or better and all currently offer a dividend yield of 1% or better.
We’ll review each of these five companies through the lens of our F.A.S.T Graphs™. For fast-growing companies like those covered in this article, every graph will be generated based on the PEG ratio formula. Therefore, the orange earnings justified valuation line will equal each company’s earnings-per-share growth rate. The light blue shaded area stacked on top of the orange line represents dividends paid out of the green shaded area, or earnings. A few of these stocks have paid dividends for a long time, while others have just begun a dividend policy. Therefore, the reader can note precisely when each of these fast-growing companies began paying dividends.
In order to illustrate the importance of valuation, each of these five selections are measured from a starting point where their stock prices were at True Worth™ value (black price line touching or below the orange earnings justified valuation line). Also, just like the super-fast growers featured in our previous article, the logical correlation between stock price and earnings will be vividly expressed. Any time the stock price gets disconnected from its earnings justified valuation, it will soon return to fair value. This is an important principle for investors to recognize and understand.
Five fast growing stocks with a dividend
AmerisourseBergen Corporation
AmerisourseBergen Corporation (ABC) is a pharmaceutical services company operating in the United States and Canada. They are a large-cap company classified as a healthcare distributor. Since calendar year 2000 AmerisourseBergen Corporation (ABC) has grown earnings at a compounded rate in excess of 16% per annum. The company instituted their first dividend in calendar year 2002 (click to enlarge).
(ABC): 12-year earnings and price correlated F.A.S.T. Graph™
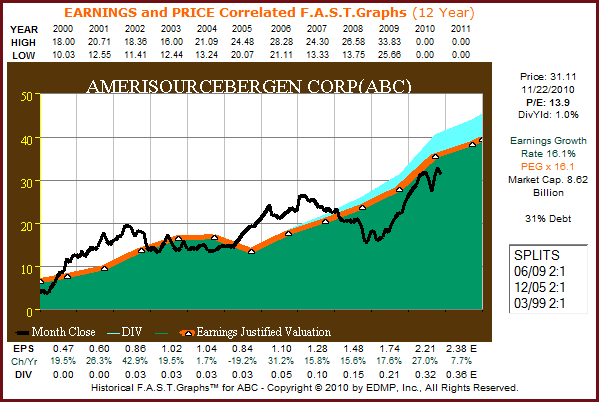
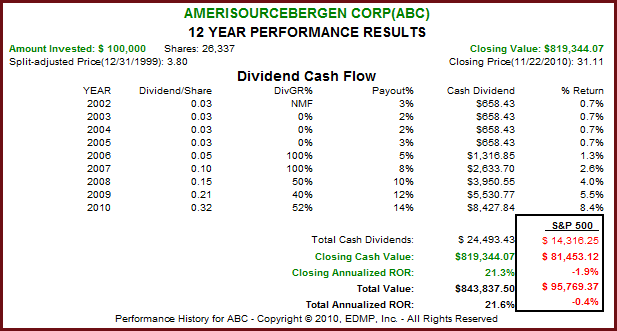
Since calendar year 2006, AmerisourseBergen Corporation (ABC) has been rapidly increasing their dividend. There is still ample room for growth, as their payout ratio has increased from a mere 2% to 3% to double-digit rates starting in calendar year 2008. AmerisourseBergenCorporation (ABC) has rewarded their shareholders far in excess of the S&P 500 since calendar year 2000. There was no lost decade for AmerisourseBergenCorporation (ABC) long-term shareholders (click to enlarge).
Church & Dwight Inc.
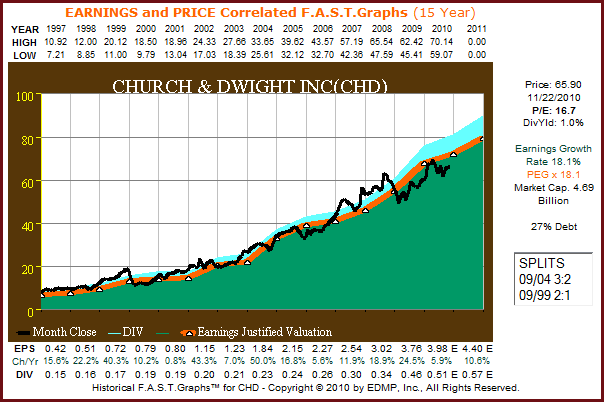
Church & Dwight Inc. develops manufactures and markets household, personal care and specialty products. They are a large mid-cap company, classified in the household products sector. Since 1997 the company has consistently increased their earnings at the above-average rate of 18.1%. Close scrutiny of their price and earnings correlated F.A.S.T. Graph™ (click to enlarge) reveals a great deal about investor psychology, and how the stock market works in the short run, and the long run.
The black monthly closing stock price line is very nervous or jagged in the shorter run, thus reflecting the emotional responses-fear and greed. However, in the longer run, the black monthly closing stock price line follows the much smoother and consistent orange earnings justified valuation line. In the long-run earnings determine market price.
(CHD): 15-year earnings and price correlated F.A.S.T. Graph
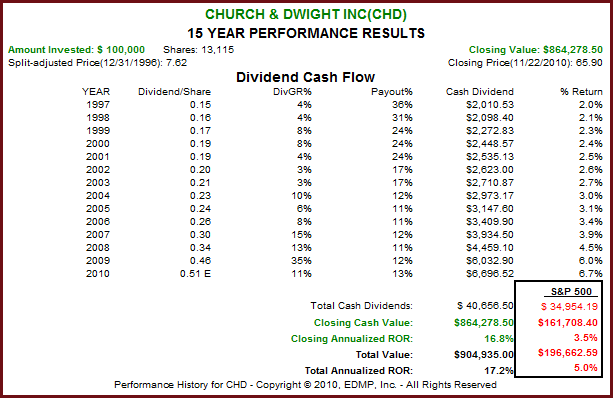
Church & Dwight Inc. has increased their dividend since1997 consistent with their earnings growth. Therefore, shareholders have not only enjoyed superior capital appreciation, they also benefited from a continuously increasing dividend income stream. Consequently, the total return on this high quality consumer products company has been exceptional (click to enlarge).
Factset Research Systems Inc.
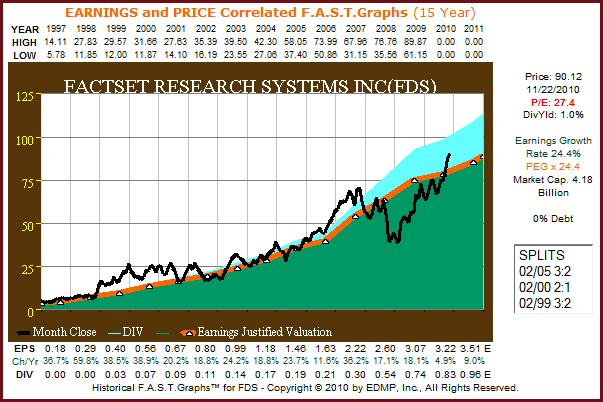
Factset Research Systems Inc. (FDS) is a provider of financial and economic information on a global scale. This mid-cap company is classified in the application software sector. Since calendar year 1997 they have grown earnings at a compounded rate in excess of 24% per annum. The company has no debt on their balance sheet and instituted their first dividend in calendar year 1999 (light blue shaded area).
The F.A.S.T. Graph™ on Factset Research Systems Inc. (click to enlarge), illustrates how stock prices track earnings over the long run. Even more importantly, it illustrates the fact that when stock prices become disconnected from earnings, over or under, they inevitably move back into alignment.
(FDS): 15-year earnings and price correlated F.A.S.T. Graph™
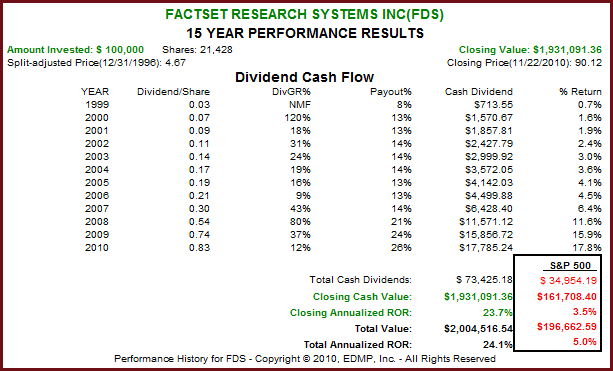
Factset Research Systems Inc. (FDS) has generated a compounded rate of return for its shareholders that closely correlates to its earnings-per-share growth. They have grown their dividend each year since they started paying one in 1999. Factset Research Systems Inc. (FDS) proves that an investor need not forgo growth in order to receive a dividend (click to enlarge).
A Risk with High Growth Stocks
With our next two examples, we are going to take advantage of the opportunity to highlight a dangerous situation that can manifest with fast-growing companies. Due to their normally higher than average price earnings ratios, fast growing companies must maintain a high and consistent growth rate. If the growth rate is interrupted, even temporarily, stock price corrections can be swift and calamitous. Therefore, it’s incumbent upon the owner of fast-growing stocks to be diligent regarding the forecasting of future earnings.
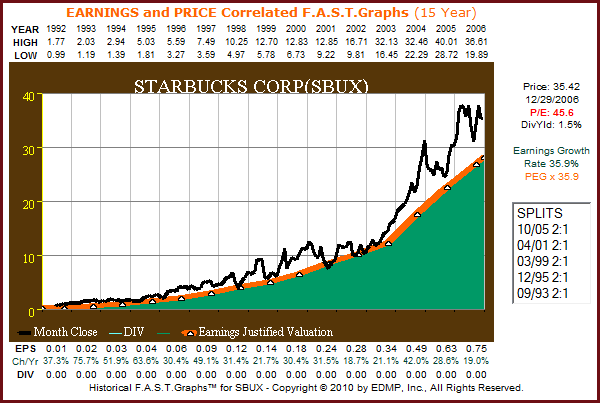
Starbucks Corp. (SBUX): A powerful growth story from 1992 through 2006
Starbucks Corporation is the leading roaster and retailer of specialty coffee. This large-cap company is classified in the restaurant sector. From calendar year 1992 through calendar year 2006, Starbucks Corp. (SBUX) grew their earnings at the exceptional rate of just under 36% per annum. During this period of high growth, the stock market often rewarded the company with a high valuation, as can be seen on the F.A.S.T. Graph™ below (click to enlarge).
(SBUX) 15-year earnings and price correlated F.A.S.T. Graph™
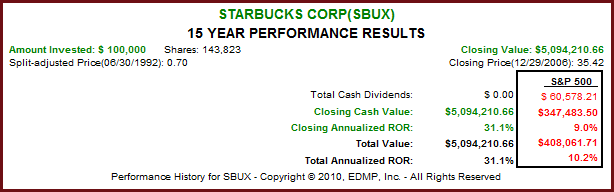
From 1992 through 2006 Starbucks Corp.’s shareholders enjoyed an excellent rate of return that exceeded 30% per annum. This was almost 3 times higher than the general stock market as represented by the S&P 500, which generated a strong total return of 10.2% in its own right (click to enlarge).
The great recession of calendar year 2008 brought the first drop in Starbucks earnings-per-share since 1992. This caused their stock, which was priced for perfection, to fall precipitously from over $36 per share to just over $8 per share. However, as earnings recovered in fiscal year 2010, so did their stock price. In calendar year 2010, Starbucks Corp. paid their first dividend, and currently offers shareholders a yield of 1.7% (click to enlarge).
(SBUX): 20-year earnings and price correlated F.A.S.T. Graph™
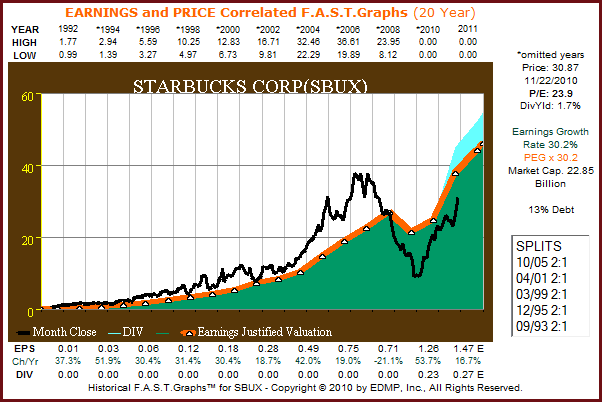
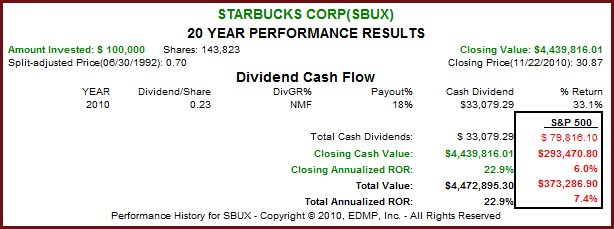
Notwithstanding their first drop in earnings per share, Starbucks Corp. earnings per share growth rate continues to average in excess of 30% per annum. This is a real testament to the power of strong, above average earnings growth. Since June of 1992 through November 22, 2010, Starbucks’ shareholders still received a compounded rate of return which exceeded 20% per annum. This is in spite of suffering the catastrophic drop in share price in calendar years 2008 in 2009 (click to enlarge).
Chicos FAS Inc.
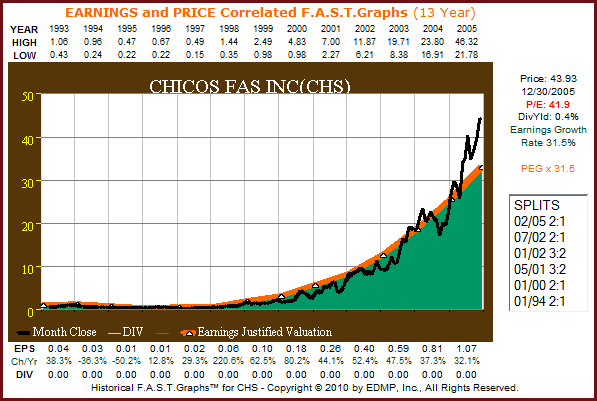
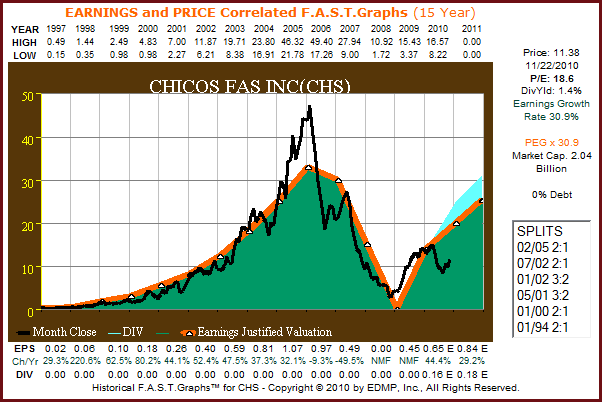
Chicos FAS Inc. (CHS) is a specialty retailer of privately branded clothing. They are a mid-cap company classified in the apparel retail sector. For the period 1993 through 2005, Chicos FAS Inc. (CHS) consistently grew their earnings in excess of 31% per annum. The stock market lavishly rewarded this performance and as of the end of calendar year 2005, Chicos FAS Inc. (CHS) was being awarded a PE ratio of just under 42 times earnings.
This was a high valuation that even their strong and consistent operating performance did not justify. Therefore, Chicos FAS Inc. (CHS) shareholders faced extreme short-term overvaluation risk (click to enlarge).
(CHS): Earnings and price correlated F.A.S.T. Graph 1993 through 2005
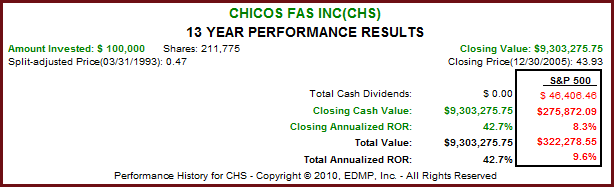
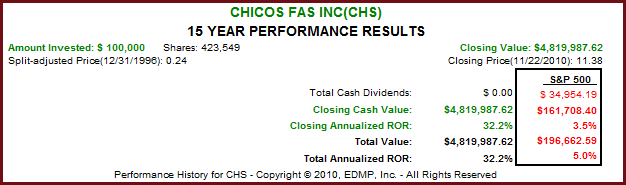
During this high growth period, 1993 through 2005, Chicos FAS Inc. (CHS) shareholders enjoyed a rate of return of over 42% per annum. This return was significantly in excess of their earnings-per-share growth rate due to the market’s richly overvaluing of their shares (click to enlarge).
During fiscal years 2007 through 2009, Chicos FAS Inc. (CHS) experienced a precipitous drop in earnings per share followed by a more precipitous drop in their stock price. The overvaluation risk cited above was exasperated by an interruption in earnings growth, and the combination proved disastrous for shareholders. Since the winter of 2008, Chicos FAS Inc. (CHS) began to experience a recovery in earnings per share. Therefore, their share price recovered from a low of just over $3 per share to currently over $11 per share. Also notice that the company instituted their first dividend in 2010 (light blue shaded area, click to enlarge).
(CHS): 15-year earnings and price correlated F.A.S.T. Graph™
Even though Chicos FAS Inc. (CHS) experienced a precipitous drop in stock price from calendar years 2005 through 2009, the long-term shareholder return was still almost triple the S&P 500. However, it would have taken a very committed shareholder, and perhaps even a foolish one, to hold the stock from 2005. Also note that because the dividend was just instituted in 2010, it does not yet show up in the performance chart below (click to enlarge).
The risks and the rewards of fast growth
These last two examples illustrate simultaneously both the power of a fast-growing company and their risk. Fast-growing companies like Starbucks Corp. (SBUX) and Chicos FAS Inc. (CHS) will often be priced at very high levels by the stock market. Therefore, even the slightest interruption in their growth can be followed by catastrophic share price collapses. On the other hand, thanks to the power of compounding, long-term shareholders can still be amply rewarded by a fast-growing business. The key is for investors to keep their eyes on earnings, and not get too enamored when stock prices are rapidly increasing.
Five fast-growing stocks with no dividends
Our next group of fast-growing companies pays no dividends. However, thanks to their consistent and strong earnings growth, the reader will find that each has generated substantial total returns for their shareholders.The main point being illustrated is the relevance of earnings. It is important to keep in mind that both capital appreciation and dividends are a function of earnings. In other words, without earnings there will be no dividends or price appreciation in the long run.
LKQ Corp.
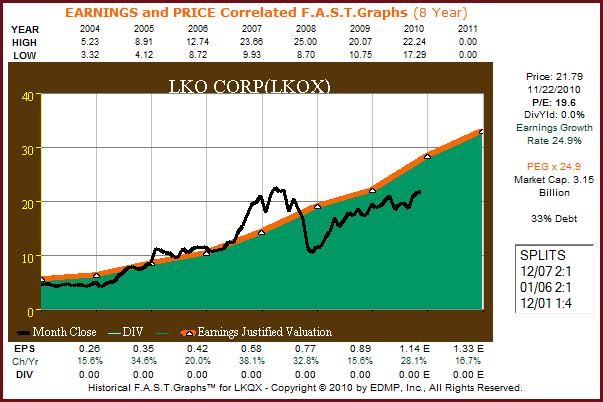
LKQ Corporation builds replacement parts needed to repair cars and trucks, thereby providing an alternative to original equipment manufacturers. They are a mid-cap company classified in the distributors sector. In calendar year 2004 their stock price was modestly undervalued and the company went on to generate earnings growth of just under 25% per annum. Notice how consistent their earnings growth was even through the great recession of 2008-2009 (click to enlarge).
(LKQX): 8-year earnings and price correlated F.A.S.T.Graphs™
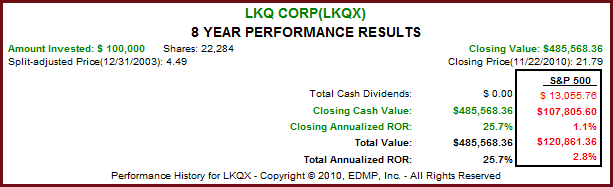
Thanks to strong earnings growth and a good starting price valuation, LKQ Corp. long-term shareholders received a total return in excess of 25% per annum (click to enlarge).
Buffalo Wild Wings, Inc.
Buffalo Wild Wings Inc. (BWLD) is an exciting young restaurant concept that went public in late calendar year 2003. The company is a small-cap and is classified under the restaurant sector. They have consistently increased their earnings in excess of 25% on average since going public. Although volatile in the short run, their stock price has followed their ascending earnings growth (click to enlarge).
(BWLD): 9-year earnings and price correlated F.A.S.T. Graphs™
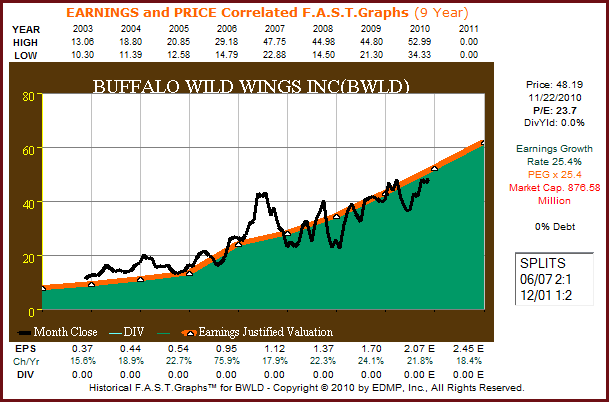
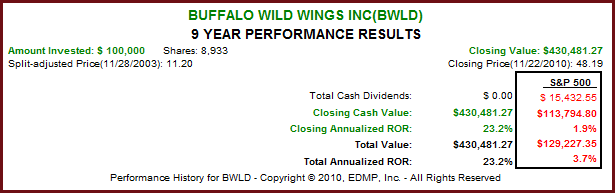
Long-term shareholders of Buffalo Wild Wings have been rewarded in almost direct proportion to their operating achievement. The case could be made that even at their current PE ratio of 23 plus, the company may still be fairly priced today. Of course, it all boils down to future earnings growth (click to enlarge).
Urban Outfitters Inc.
Urban Outfitters Inc. (URBN) is a mid to large cap specialty retail company classified in the apparel retail sector. Urban Outfitters Inc.(URBN) has generated very strong compounded earnings growth in excess of 22% a year since 1997, even though their powerful earnings growth has been inconsistent from time to time. Consequently, even though monthly closing stock prices trended with earnings, there have been extreme bouts of volatility along the way (click to enlarge).
(URBN): 15-year earnings and price correlated F.A.S.T. Graphs™
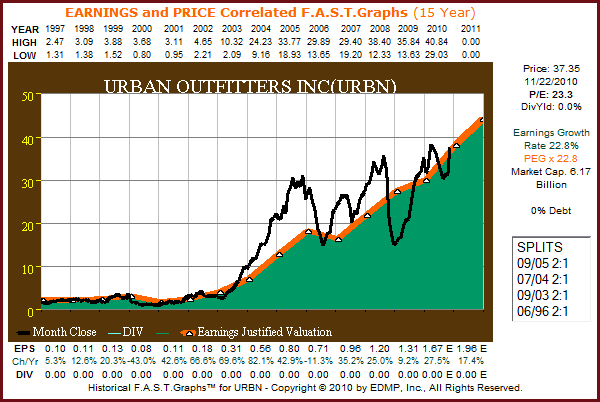
Even considering numerous bouts of very volatile stock price action, over the long run, Urban Outfitters Inc. (URBN) shareholders have been rewarded in direct proportion to the company’s long-term earnings growth (click to enlarge).

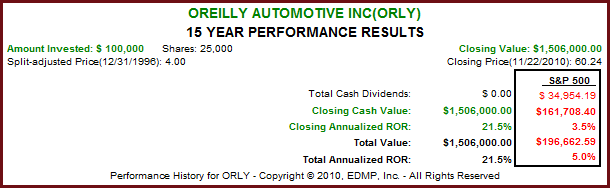
O’Reilly Automotive, Inc.
O’Reilly Automotive Inc. (ORLY) operates a chain of specialty retail automotive after market parts, tools, supplies, equipment, and accessories that markets to the do-it-yourself customer. They are a large cap company, classified under the automotive retail sector. This company represents a classic example of how stock prices follow earnings over the long run (click to enlarge).
(ORLY): 15-year earnings and price correlated F.A.S.T. Graphs™
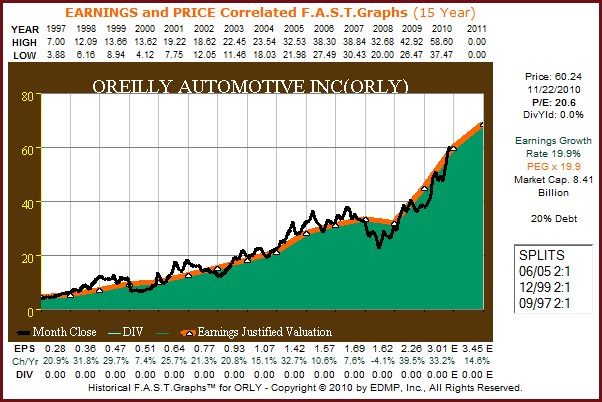
Long-term, O’Reilly Automotive Inc. (ORLY) shareholders were rewarded in direct proportion to the company’s earnings growth (click to enlarge).
Amphenol Corp.
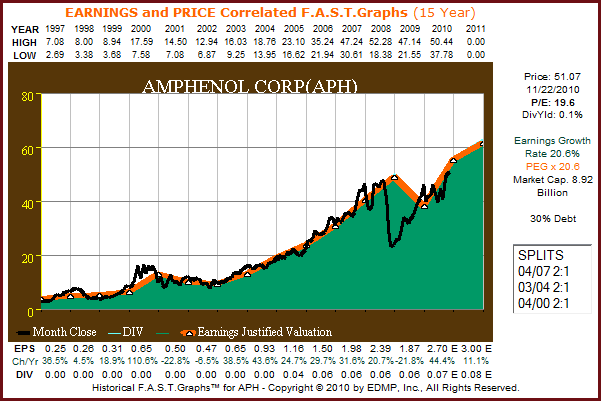
Amphenol Corp. (APH) designs, manufactures and markets electrical, electronic and fiber-optic connectors, interconnect systems and coaxial and high-speed specialty cable. They are a large-cap company classified under the electronic component sector. Amphenol Corp. (APH) has grown their earnings at a compounded rate of just over 20% per annum since 1997. The company did suffer some operating stress during the great recession of 2008-2009, and the market overreacted. However, both earnings and stock price have recovered nicely. Once again, the importance of earnings cannot be denied (click to enlarge).
(APH): 15-year earnings and price correlated F.A.S.T. Graphs™
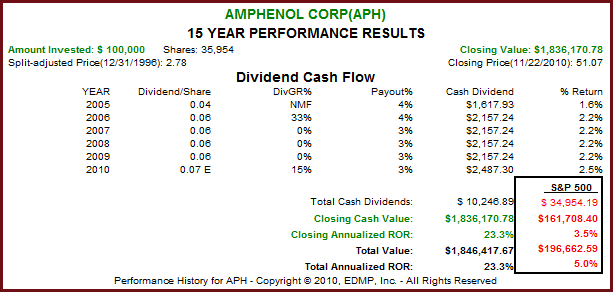
Amphenol Corp. (APH) represents a final example of a fast-growing company whose shareholders were rewarded in direct proportion to their earnings growth. The company initiated a small dividend in calendar year 2005; however, with a yield of only 1/10 of 1%, this company is categorized in the non-dividend paying group. Even without a substantial dividend, Amphenol Corp.(APH) produced an exceptional total return for their loyal shareholders since calendar year 1997 (click to enlarge).
Summary and Conclusions
This article reviewed a diverse cross-section of consistent fast-growing companies of various sizes, from small to large. Half of them pay dividends, and the other half do not. Yet all of them generated exceptional rates of return on the behalf of their long-term shareholders. The strong returns were a function of only measuring them over time periods where starting valuations were sound, followed by strong and consistent earnings performance.
Each of these examples could serve as a poster child, depicting the critical importance of earnings and valuation. A careful review of each company’s F.A.S.T. Graph™ will reveal that over the long run their stock prices commanded a price earnings ratio that was consistent with their average earnings-per-share growth. Consequently, it should be understood that the faster growing company is worth more than the slower growing company. Therefore, you can pay a little more to buy a faster grower.
Since many of these companies are small, the issue of risk needs to be discussed. As long as each company’s earnings continued to grow, the risk from paying a higher valuation to buy them was amply rewarded. You may also have noticed that both groups, the dividend paying and the non-dividend paying, produced very similar returns. The total returns for both sets of companies was driven by the earnings results that each achieved.
On the other hand, a few words in favor of the dividend payers are in order. Since fast growing companies tend to be riskier than slower growers, risk should always be a consideration. One advantage that a dividend paying stock offers is both the return of and the return on capital invested. With each dividend paid, the investor has less capital at risk, and therefore, each dividend payment reduces risk. Consequently, a strong case is made that the dividend payers produce similar returns with lower risk taken.
Disclaimer: The opinions in this document are for informational and educational purposes only and should not be construed as a recommendation to buy or sell the stocks mentioned or to solicit transactions or clients. Past performance of the companies discussed may not continue and the companies may not achieve the earnings growth as predicted. The information in this document is believed to be accurate, but under no circumstances should a person act upon the information contained within. We do not recommend that anyone act upon any investment information without first consulting an investment advisor as to the suitability of such investments for his specific situation.