Analyze the Fundamentals with FAST Graphs
FAST Graphs is a stock research tool that puts all the necessary and relevant information to make educated decisions at the subscribers’ fingertips in as little time as possible and with minimal effort.
With FAST Graphs, you can quickly analyze the operating history of a company with a variety of interactive charts that can display a range of different metrics. This can alleviate the need to filter through cumbersome financial statements and save a lot of time and stress.
On the graph, the orange line represents fair value for the specified timeframe, and is backed by the growth rate of the company. By observing the change in the charts, you can see whether the stock price is trending up, down, or staying stable, but also where it has been and where it should be headed.
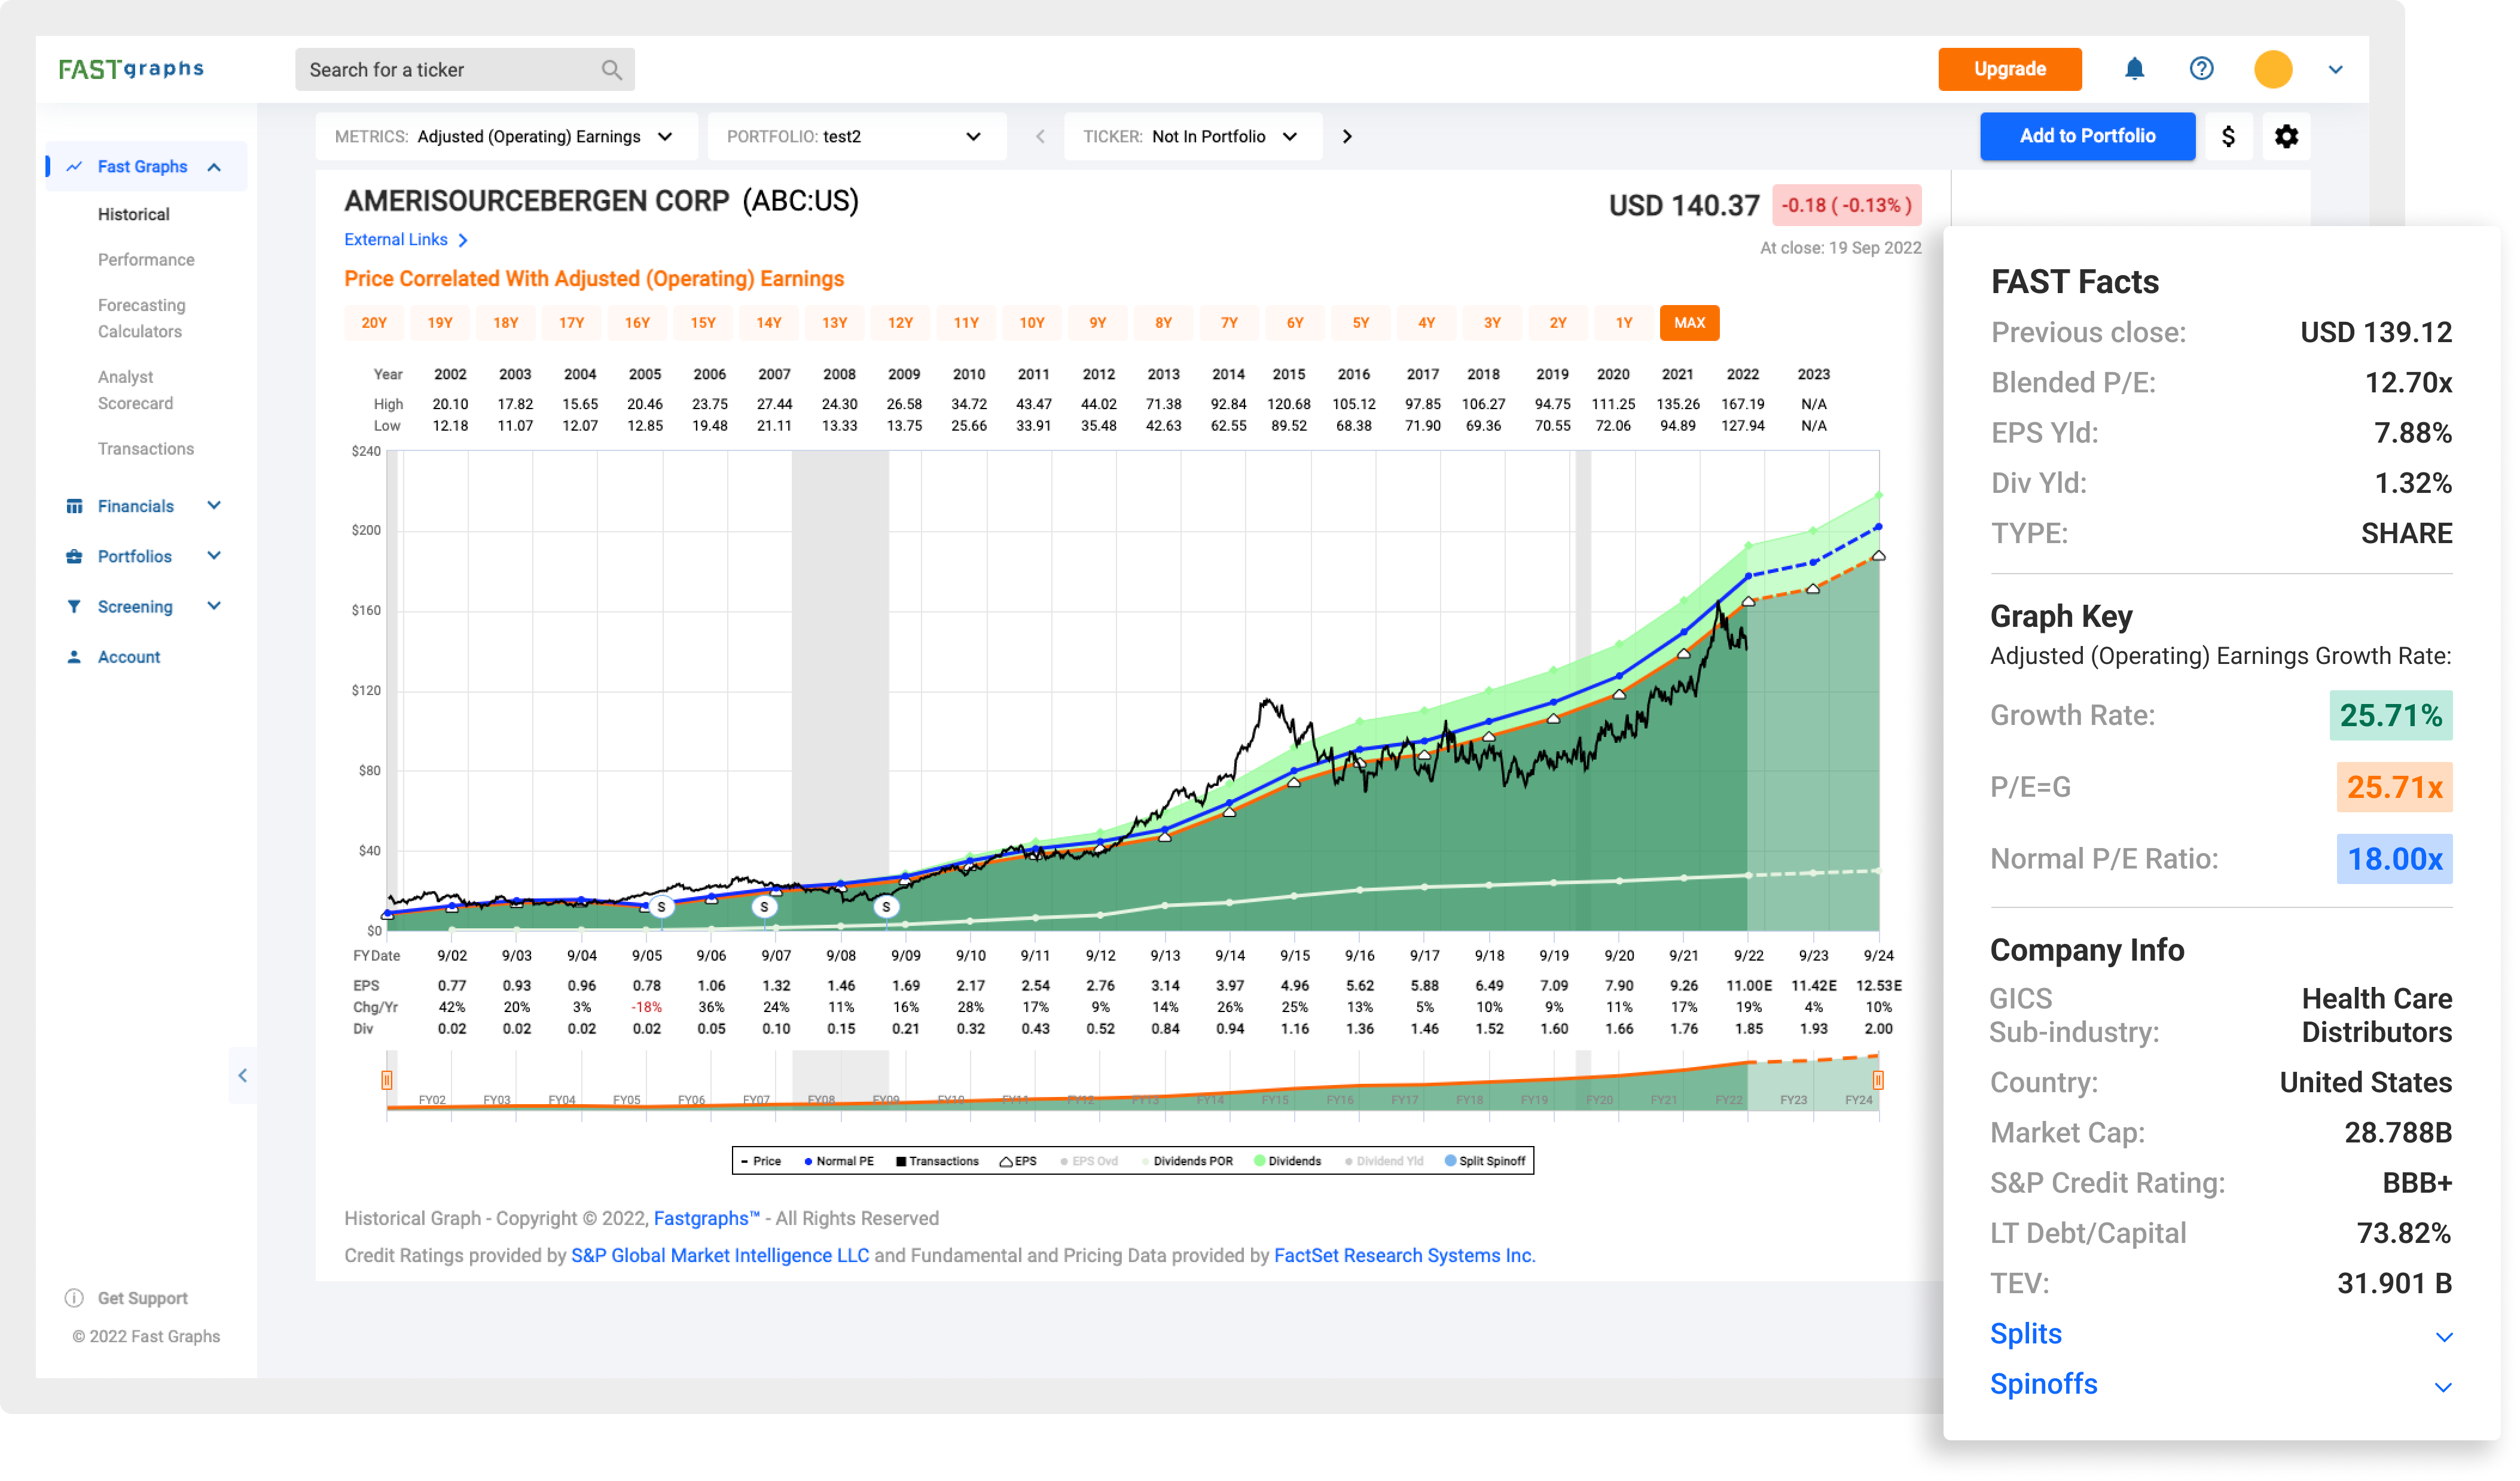
This Historical Chart is a dynamic graphing solution that recalculates based on different time frames. This gives you the ability to see the fair value of the company you are looking at throughout different timeframes in its operating history. You can go back and analyze how the company was valued and performed during the 2008 recession, or you can even look at different lengths of operating results based on where the company is currently at.
Companies change vastly over time, and so does valuation. It all boils down to how fast a company has grown over a period of time.
With thousands of fantastic companies in business, it is important to know which ones are worthy of investment.
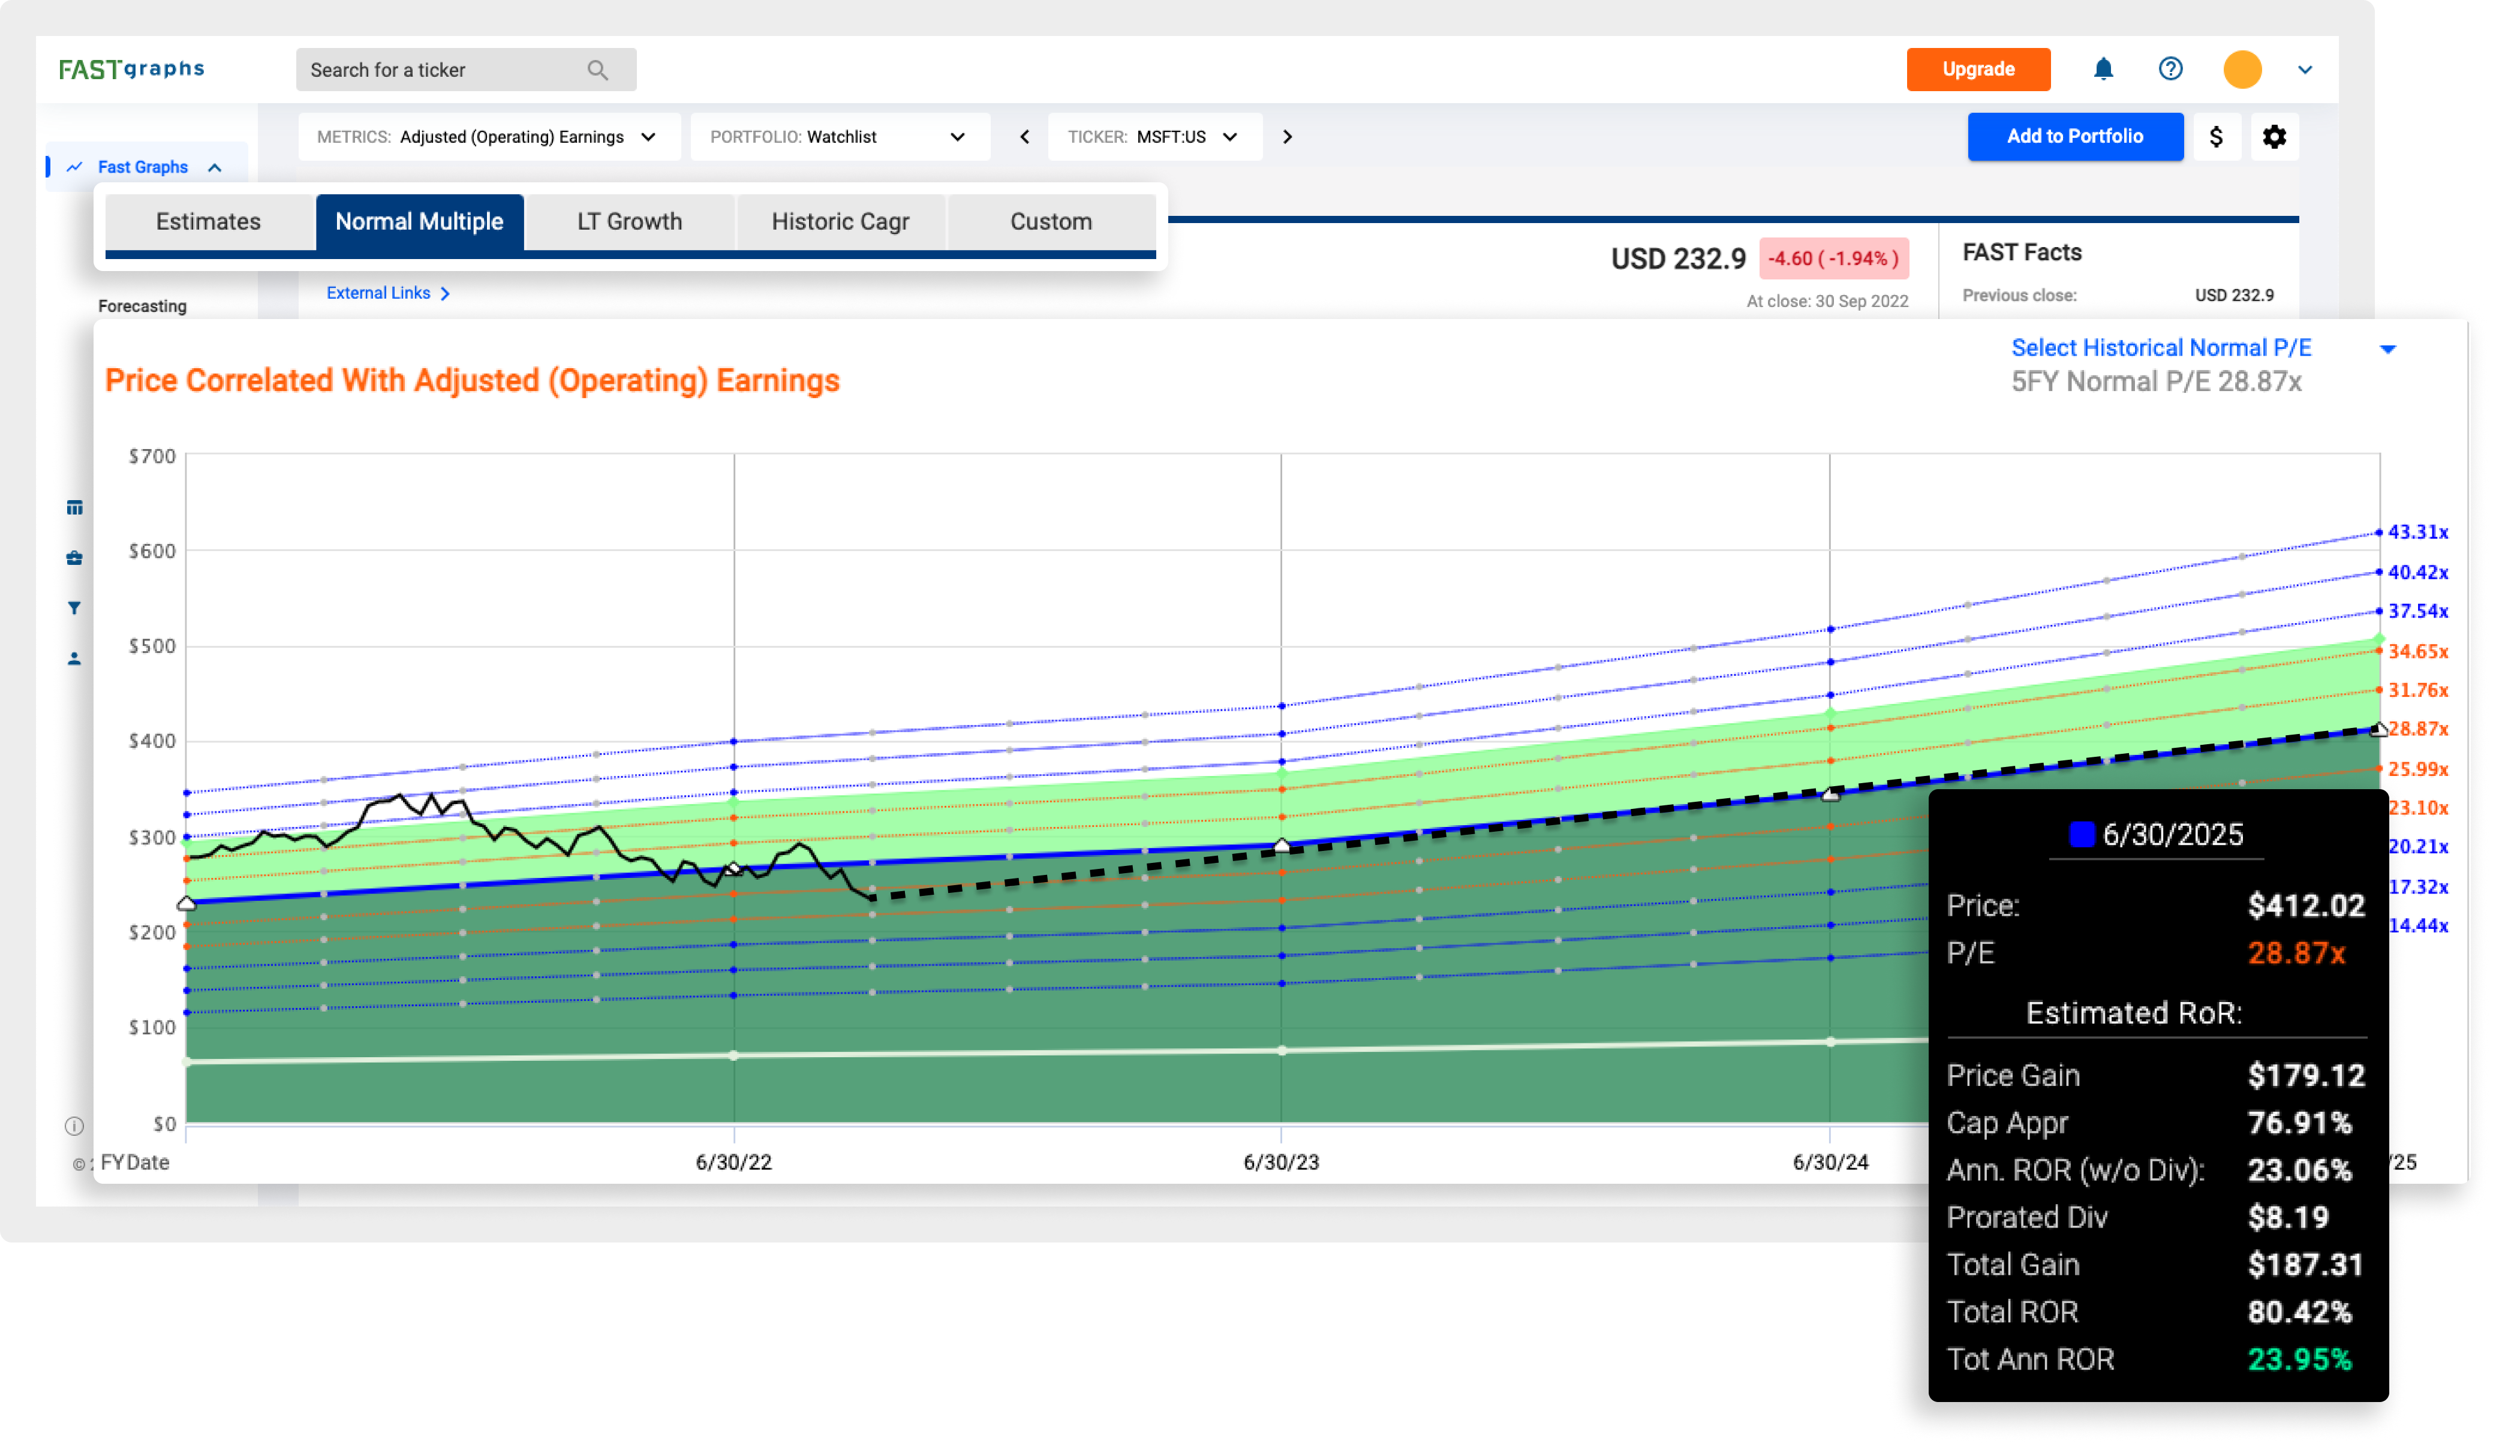
To make an excellent investment, you need to find a strong company with a promising valuation. You never want to overpay for an investment, nor buy an investment that does not meet your investment needs. The Forecasting Calculators let you see the possible returns from each, so you can see which is worth investing in, and which might be worth keeping an eye on.
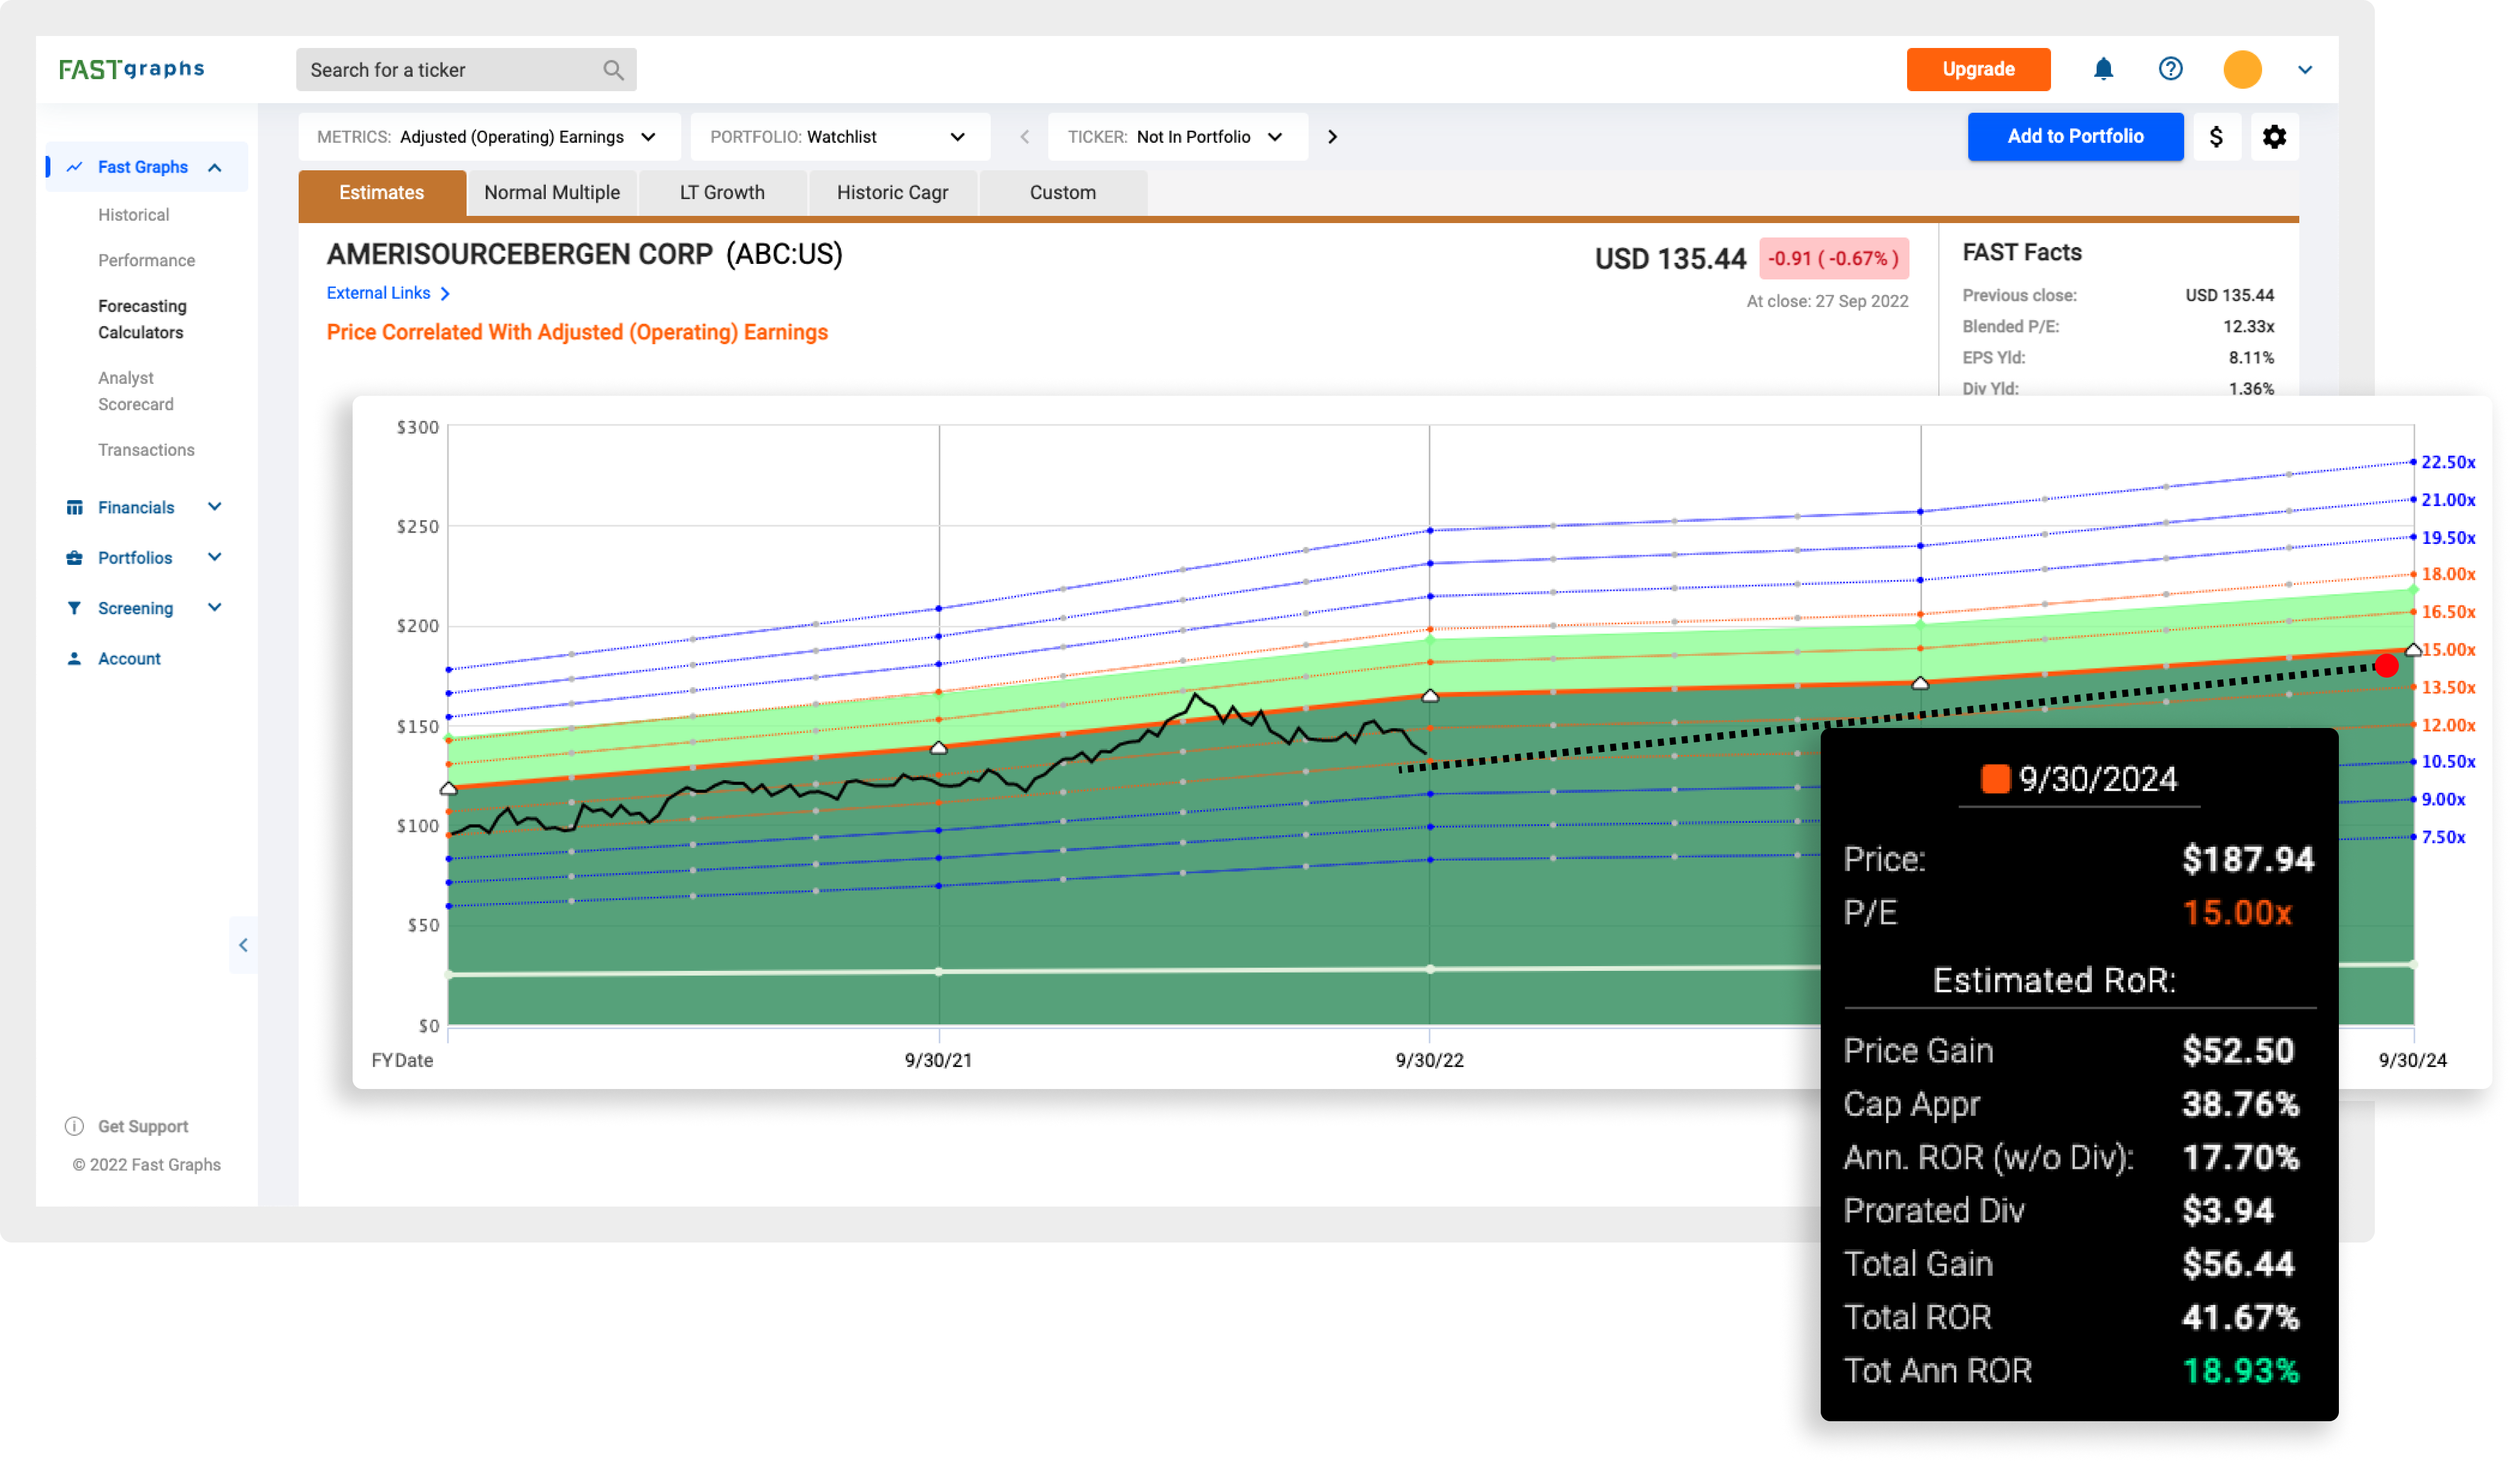
FAST Graphs provides five different Forecasting Calculators that give different perspectives that can boost confidence in your investments. These forecasts are sourced from professional analysts, but you are able to input your own information to fill in any gaps or create your own estimates by overriding information with your own.
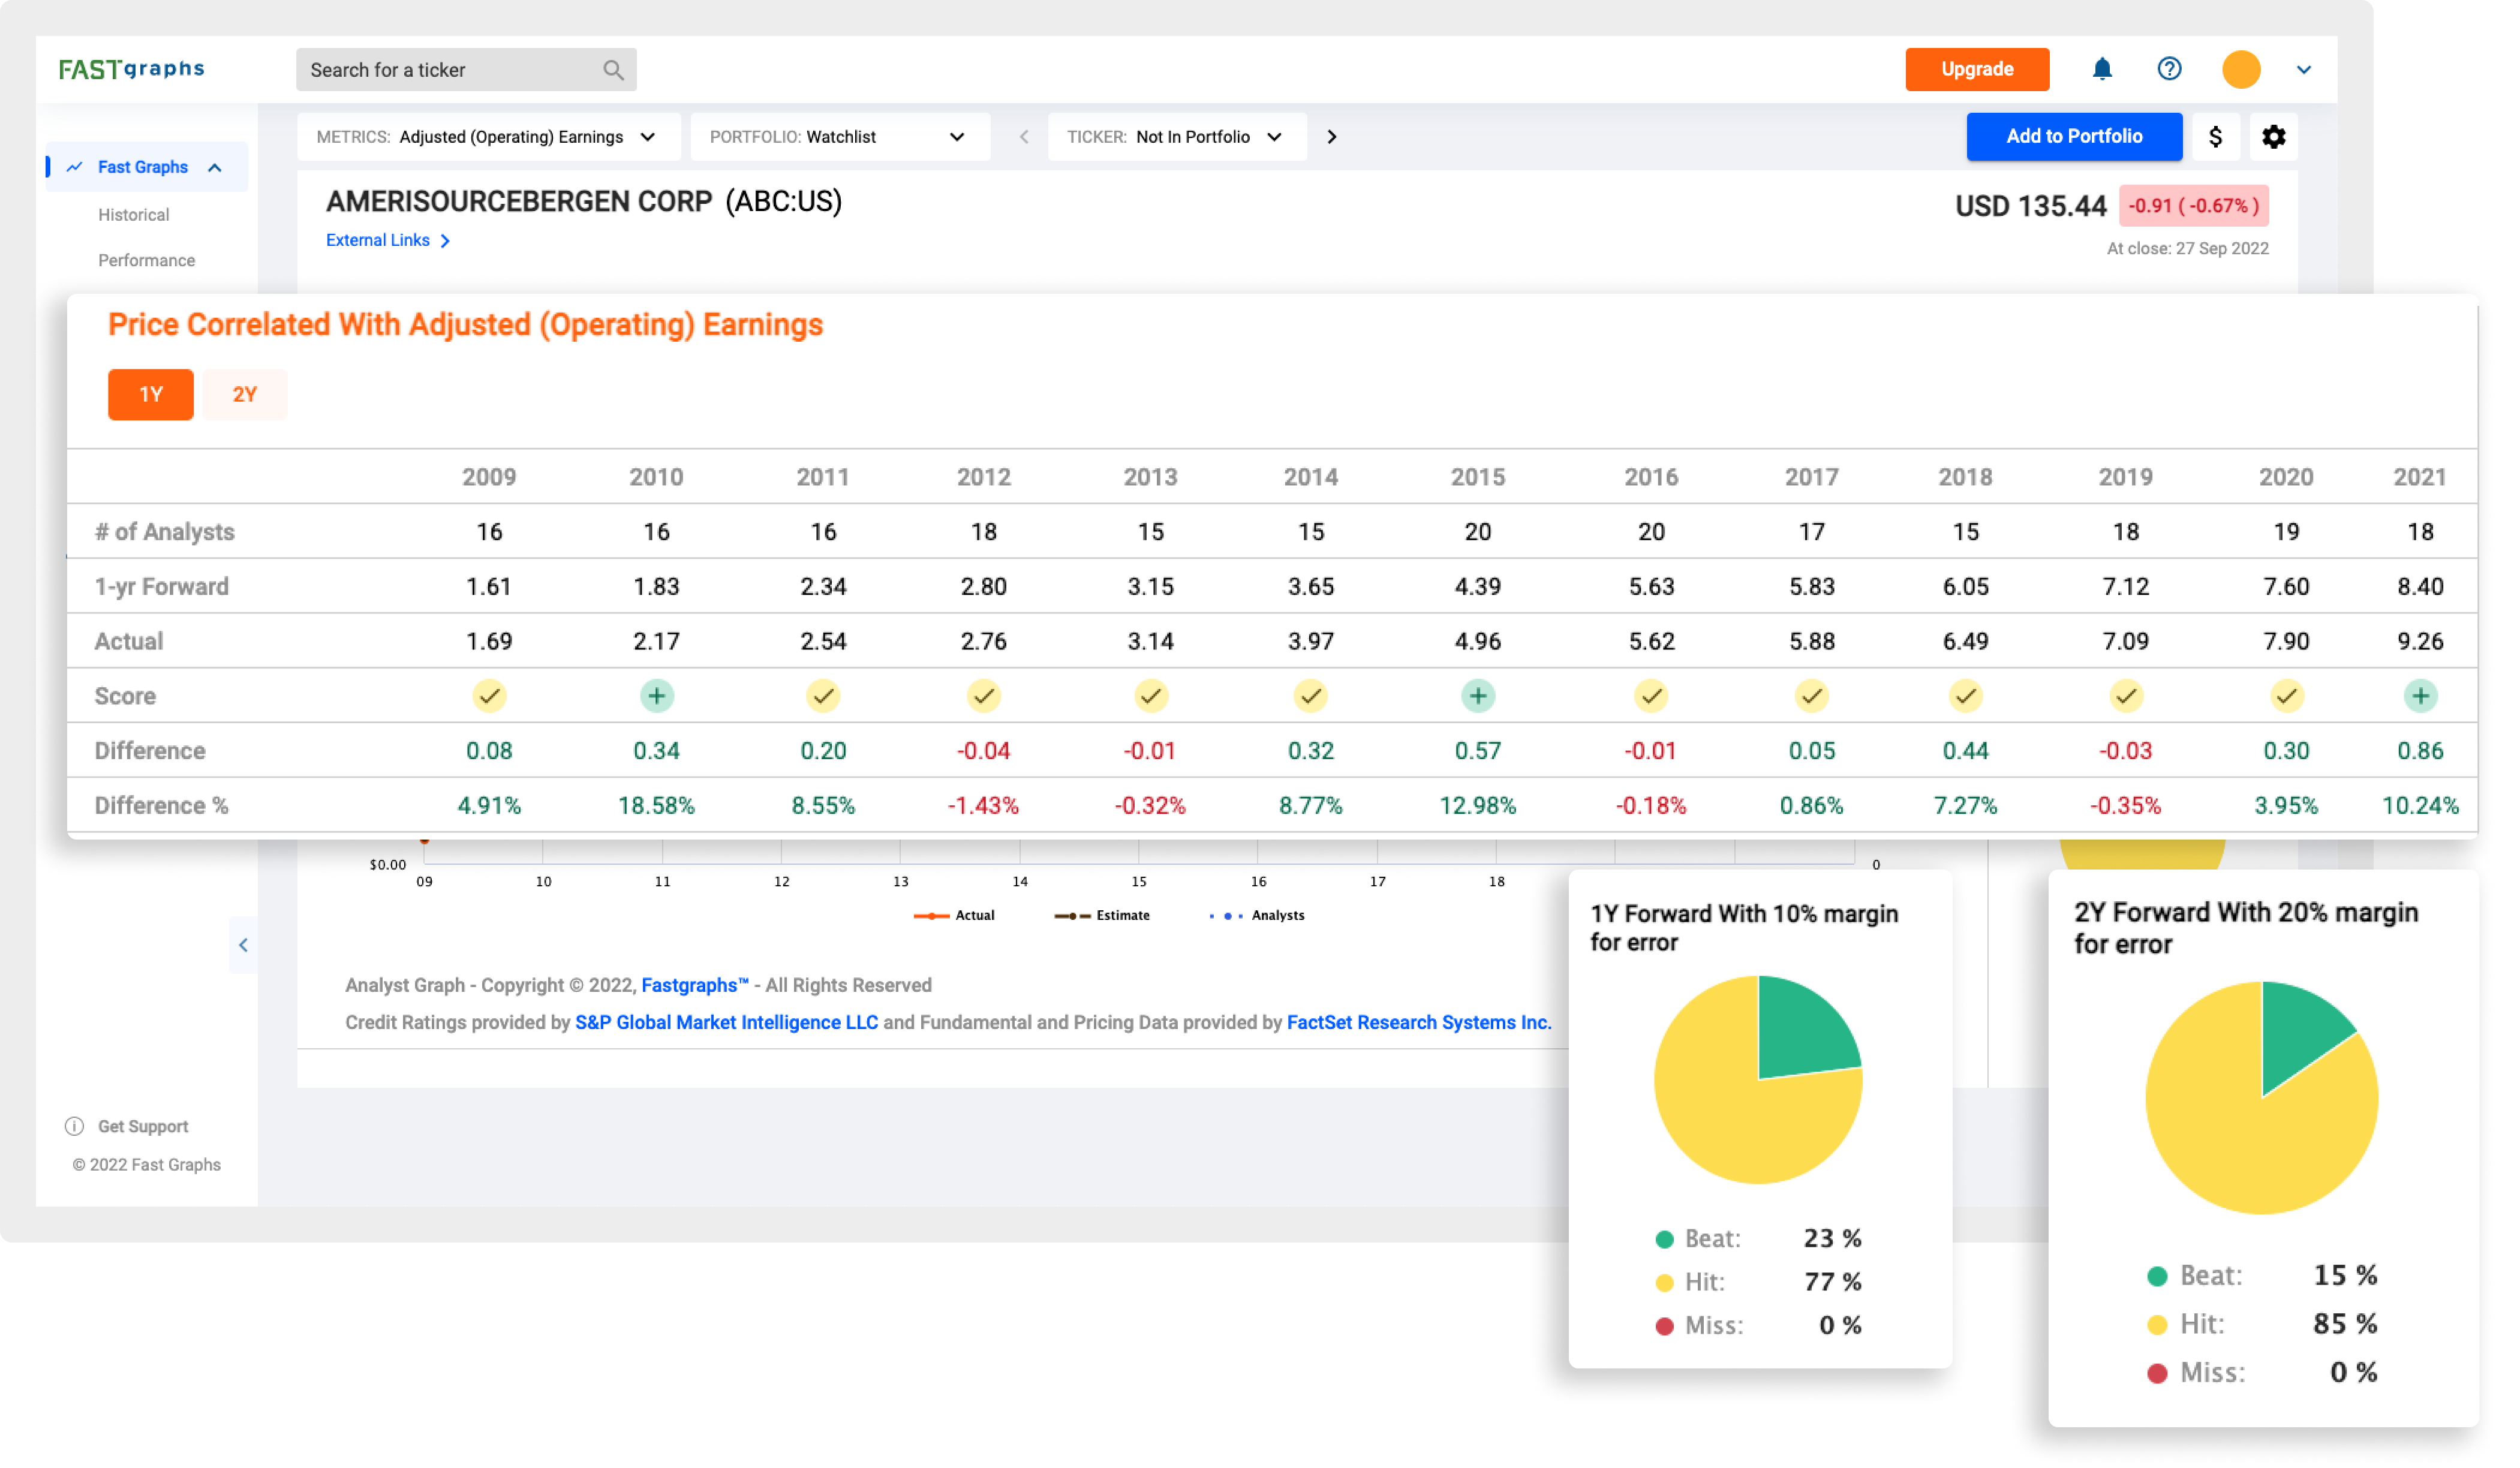
Analysts can change their forecasts every day. In order to get a better grasp on the stability of a company’s financials, the Analyst Scorecard locks in the estimates made over the previous two years which can help show long term predictability as well as the certainty of their estimates.
Because long term investing is key to success, certainty in a company’s financials is extremely important.
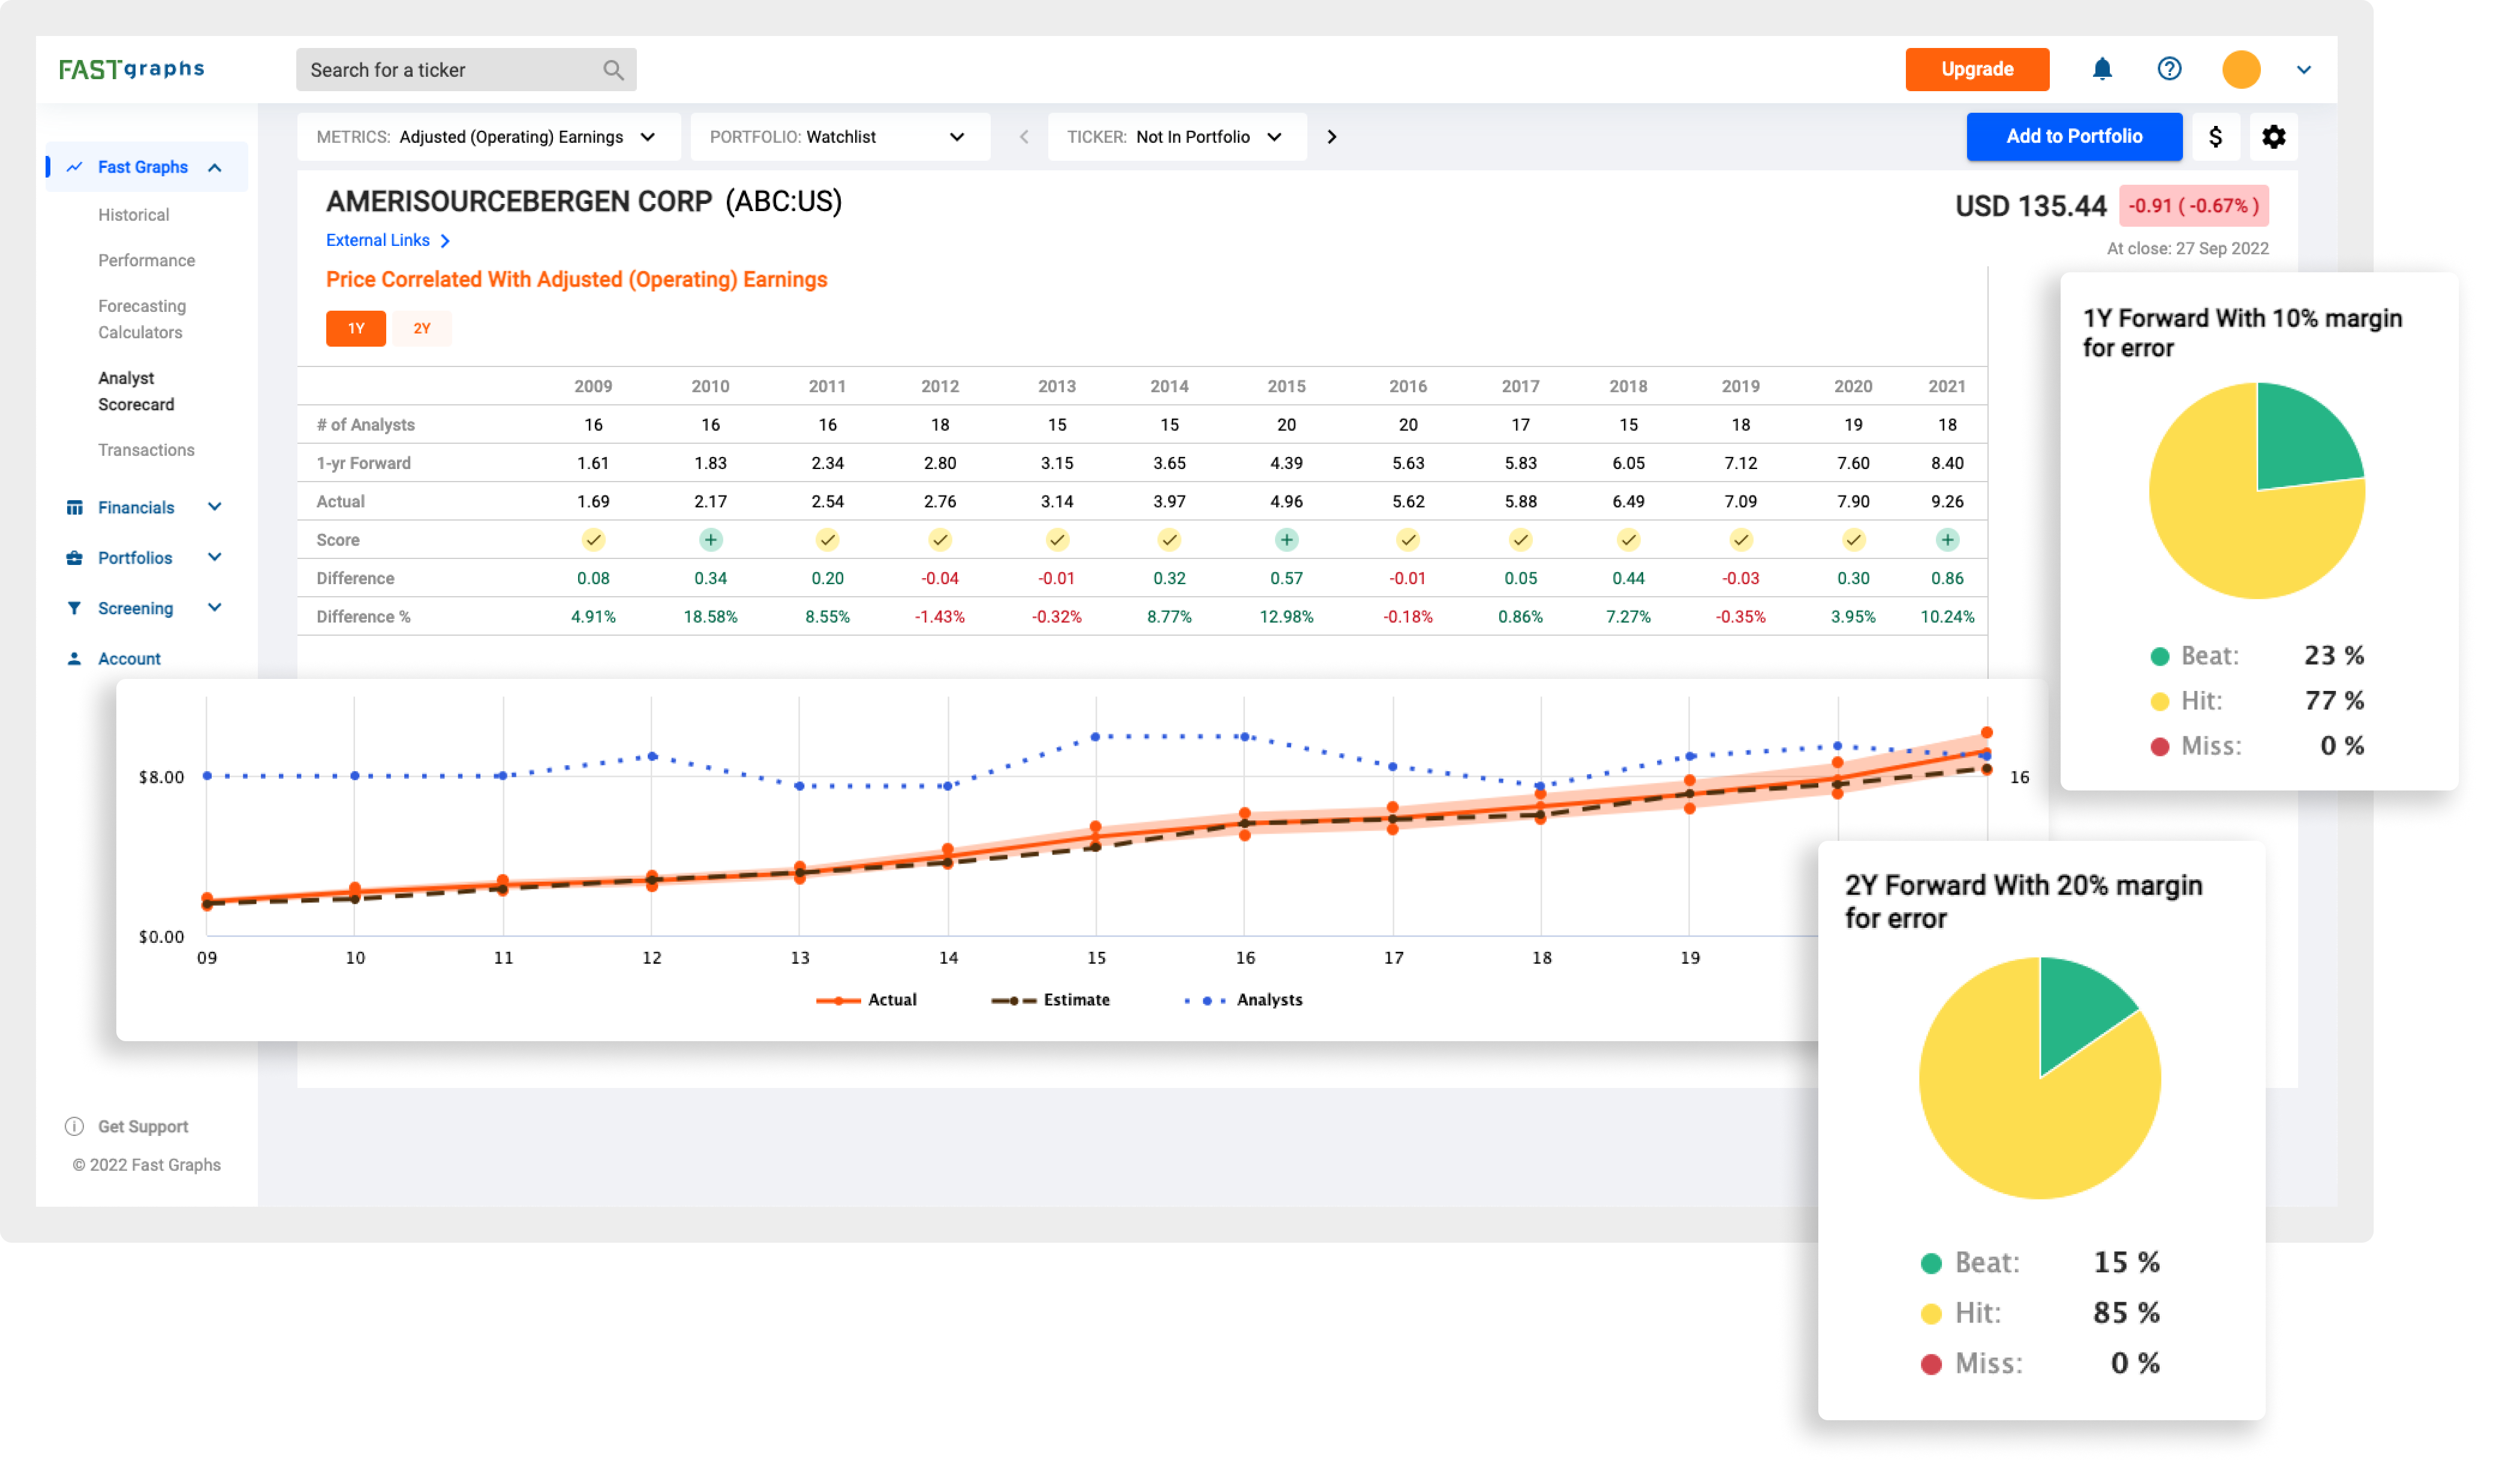
Analysts are not perfect, but their forecasts should be within an error of margin when comparing the accuracy of their estimates. Our scoring system anticipates a 10% margin of error on one-year estimates, and a 20% margin of error on two-year estimates.
This scoring system helps build confidence in the analysts, as well as the long-term predictability of the companies in question.