
Portfolios
Portfolios gives you the ability to track lists of stocks and ultimately utilize FAST Graphs to conduct research. From the "Portfolios" menu, you’ll be able to create portfolios, review the portfolio, immediately graph the portfolio, edit the list of tickers, and edit the Buys and Sells for the individual stocks within it.
Here is a short tutorial on Portfolios
Create a Portfolio (Simple)
To create a portfolio, go to the "Portfolios" tab, click "My Portfolios" - "Create Portfolio."

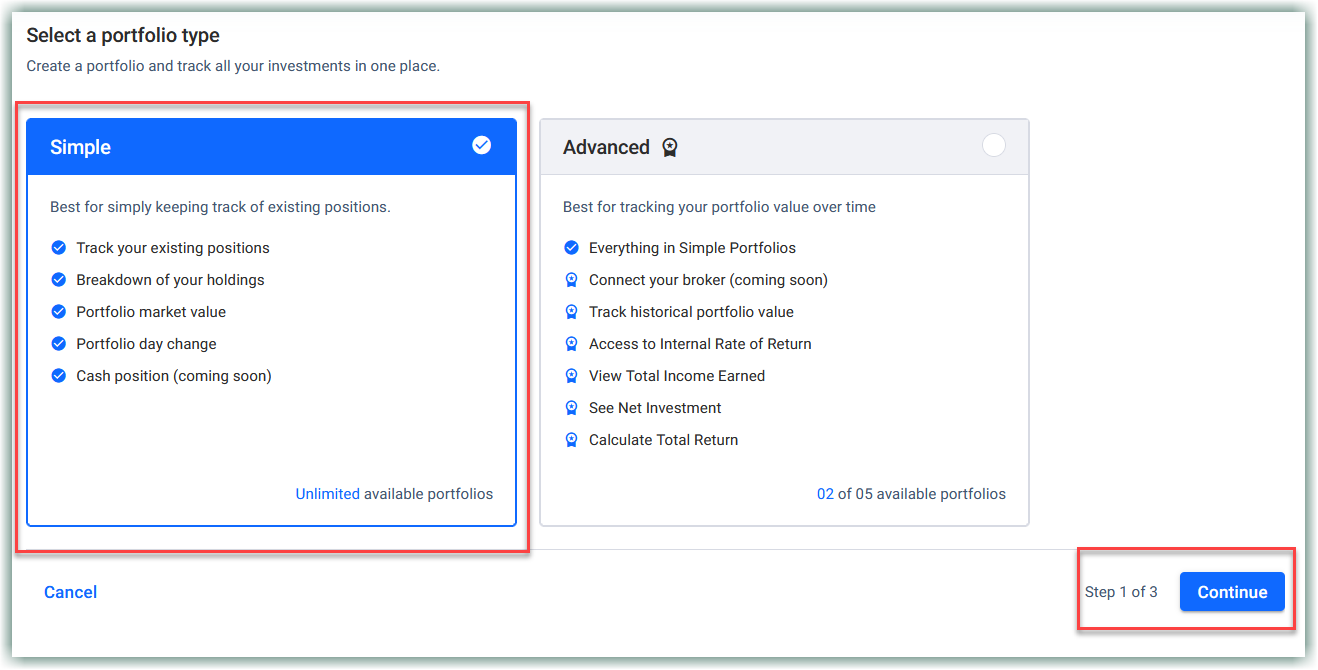
Select A Portfolio Type
Choose "Simple" - then click "Continue"
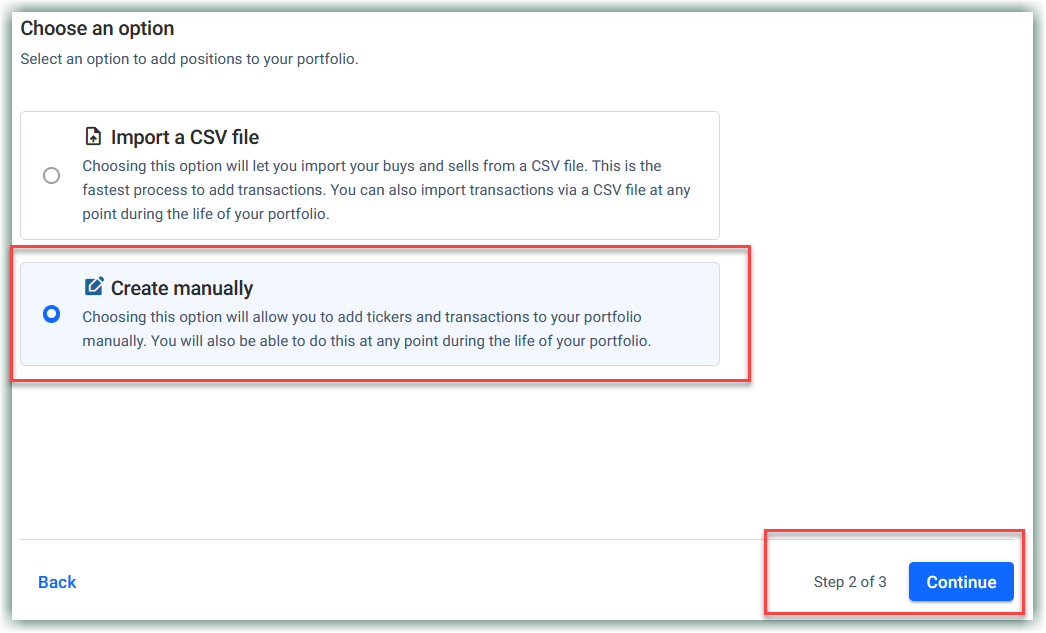
Choose an Option
In this section you can choose to "Import a CSV file" or "Create Manually"
In this example we are going to "Create Manually" - then click "Continue"
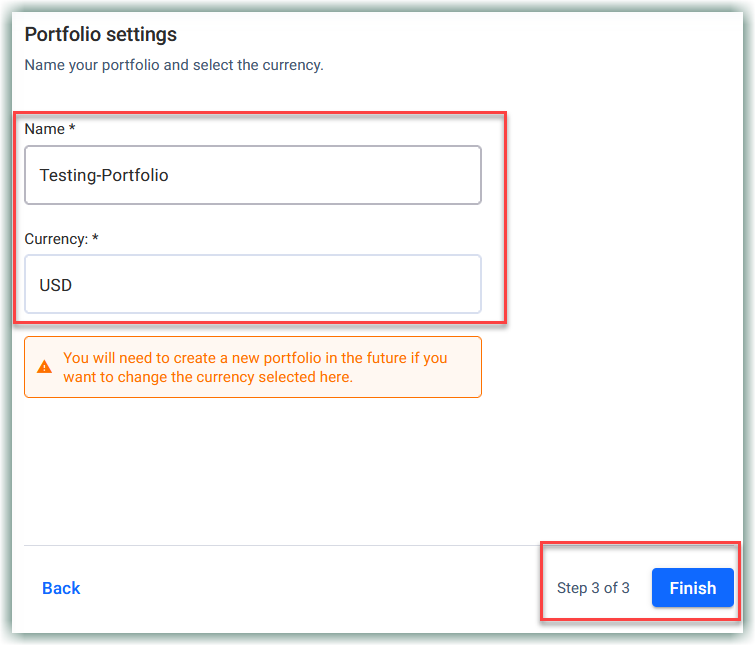
Portfolio Settings
Name your portfolio and select the currency. NOTE: You will need to create a new portfolio in the future if you want to change the currency selected here. After you "Name" the portfolio and choose the "Currency" - then click "Finish"
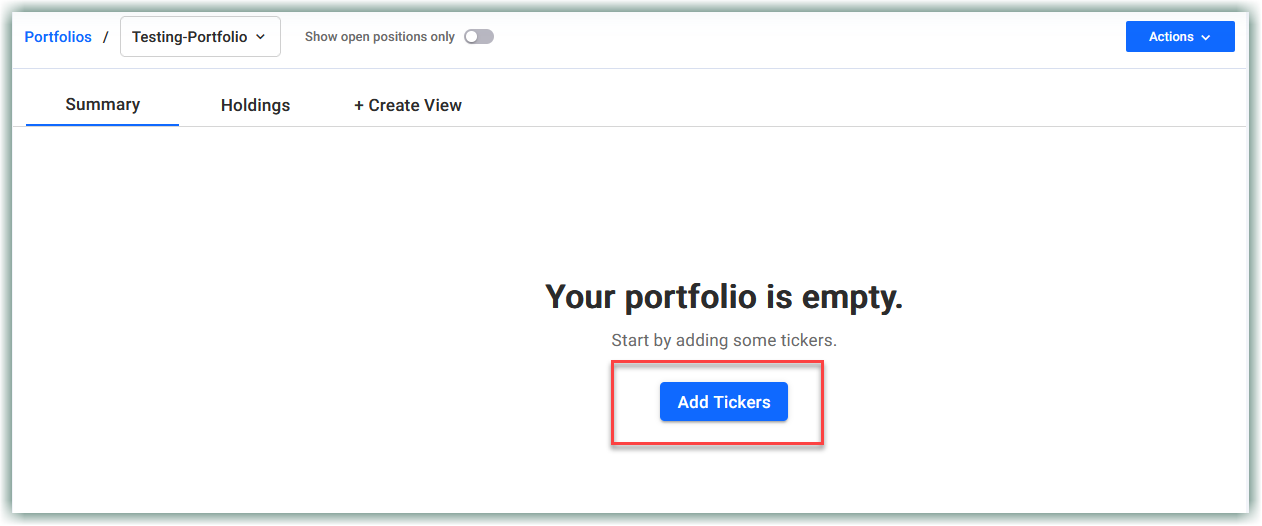
Summary
Your portfolio is empty so now you will click "Add Tickers"
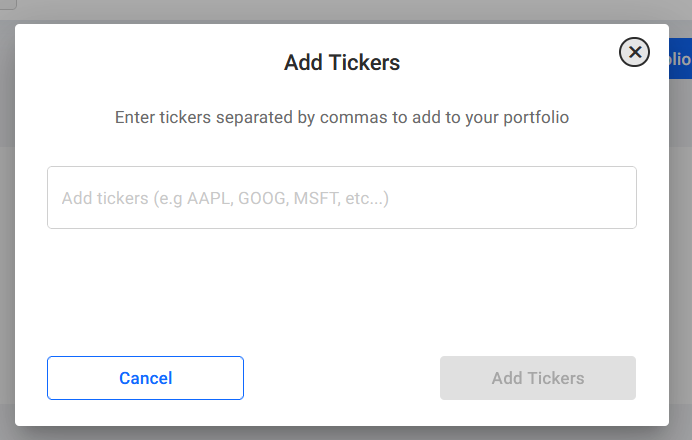
Add Tickers
You will be taken to a screen to "add tickers" into the portfolio. Enter the tickers of all the companies you want added to the portfolio with spaces between them (Only put the ticker symbol in, do not put the exchange in.) and hit "Update". Your portfolio will then be listed on the main portfolio screen.
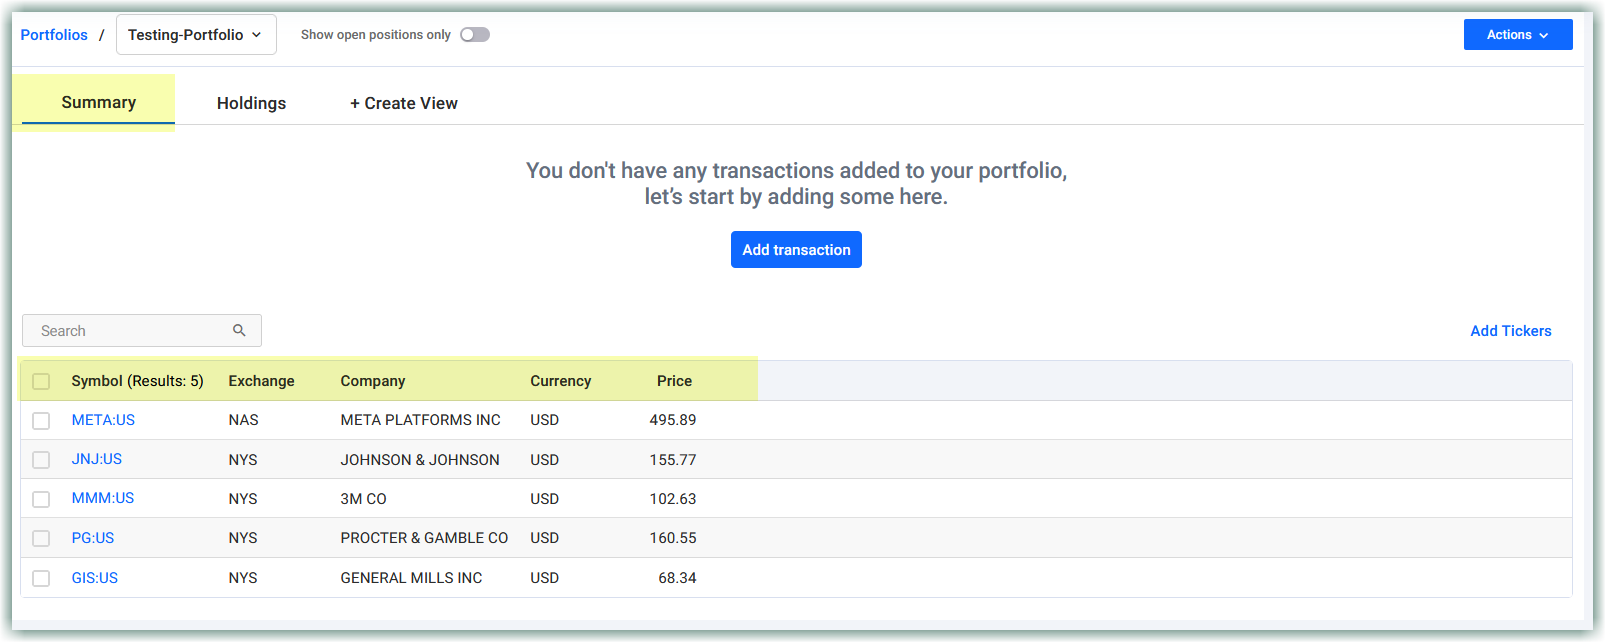
Once you have a portfolio created, the main screen will show the portfolio name, followed by the number of stocks in the portfolio, and then followed by these columns:
- Symbol
- Exchange
- Company
- Currency
- Price
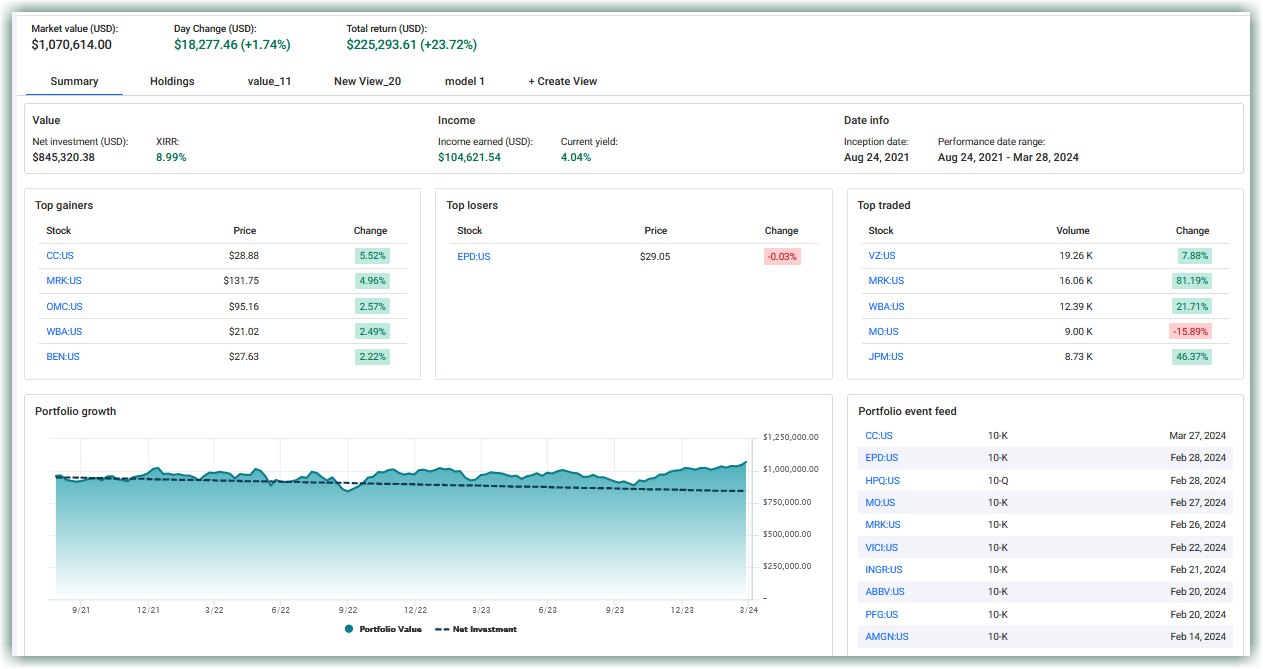
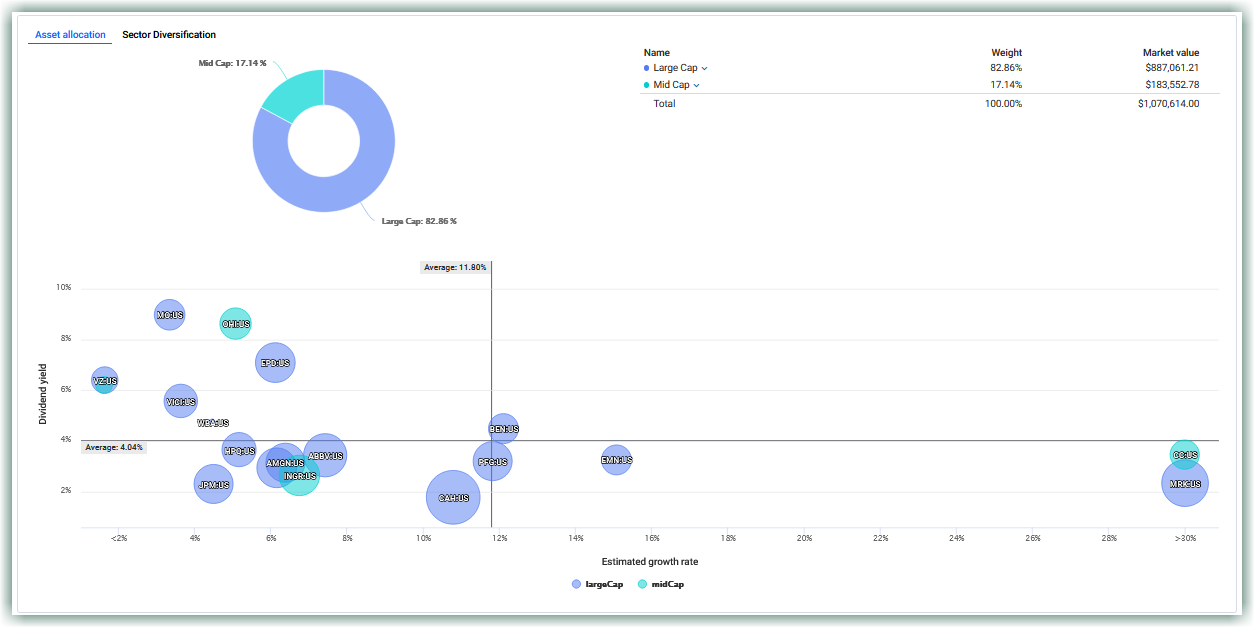
Advanced Portfolios (Premium Subscribers)
Advanced Portfolios offers the Premium Subscriber a more refined and detailed approach to investment tracking and analysis. Users can create up to five (5) advanced portfolios, each boasting a range of sophisticated features.
Advanced Portfolios Tutorial
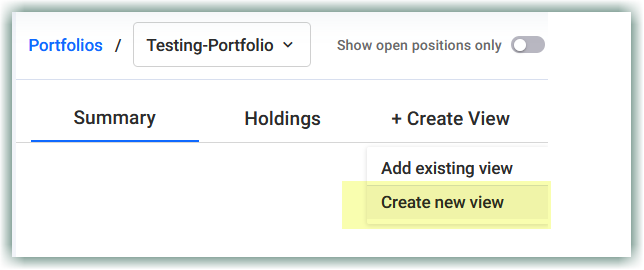
Create View
You can create a new view - or "Add existing view"
Columns for Create View
Create New View
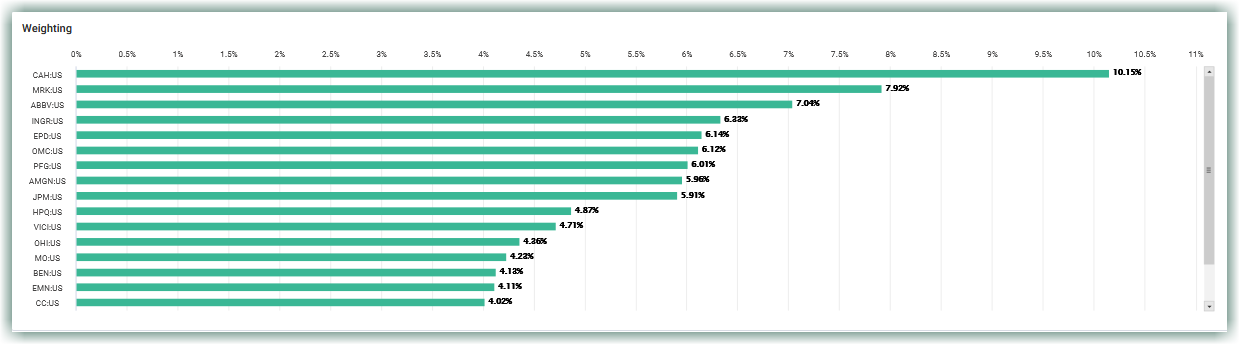
Clicking on "Create View" will bring you to the Portfolio Review for the selected portfolio. From here, you’ll be able to customize the view of the portfolio and sort on specific metrics that you are looking for to help understand the value of the stock. You’ll also be able to draw any stock in the portfolio as a FAST Graph by clicking on the ticker.
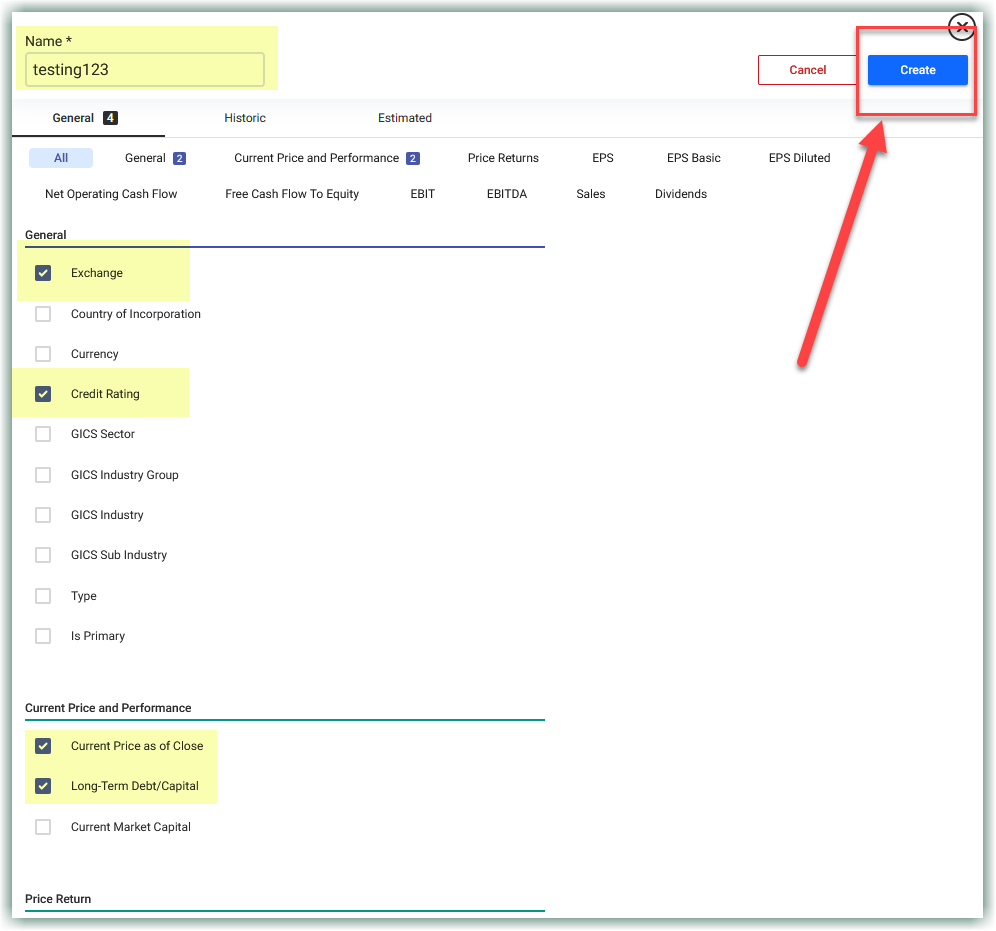
To name this view, go in the "Name" box and title your view. Once you have chosen your fields, click the blue "Create" button.
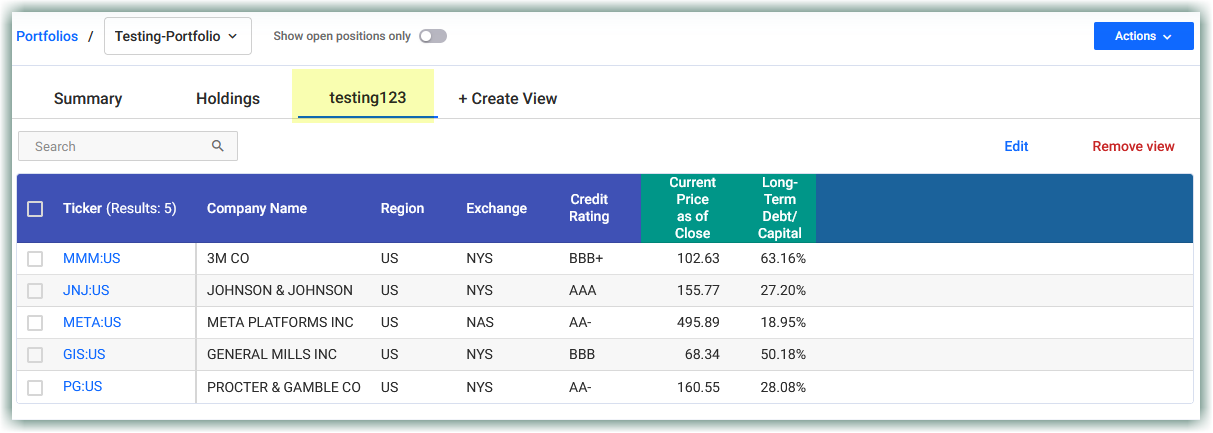
In this example below we have put a checkmark in "Exchange" - "Credit Rating" - "Current Price as Close" - "Long-Term Debt/Capital" - remember to complete by clicking "Create."
That takes you to the view we just created. From here you can then click on a ticker and go to graphing, or you can "edit" your view and add more information. You can move your columns in different positions, and also sort your columns from ascending to descending.
NOTE: You can create as many views as you like. Choose Titles so you can easily add these views to other portfolios.
Re-usable Views (VIDEO)
You can easily reuse views across all your portfolios and preset portfolios. No more hassle of repeating the same process for each portfolio! Plus, we've introduced a centralized View Manager where you can create, modify, and manage your views effortlessly.
How To Delete A Ticker Out Of A Portfolio
There are two ways to delete tickers from portfolios.
One way is to go to "My Portfolios"
Click on the name of the portfolio that you want to delete a ticker from.
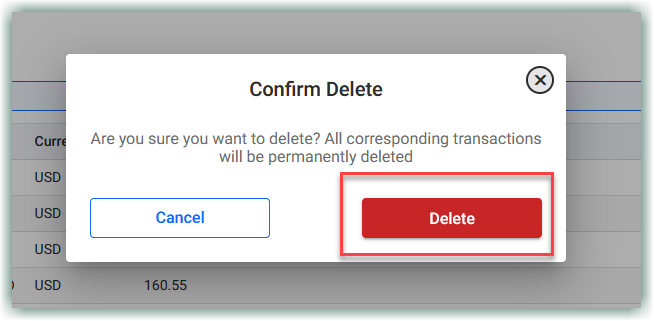
That will take you to the "Summary" of that portfolio where you will put a checkmark in the box to the left of each ticker you want to delete. That will bring up a "Delete Tickers" button in the upper right, click "Delete Tickers"
You will be asked to "Confirm Delete"
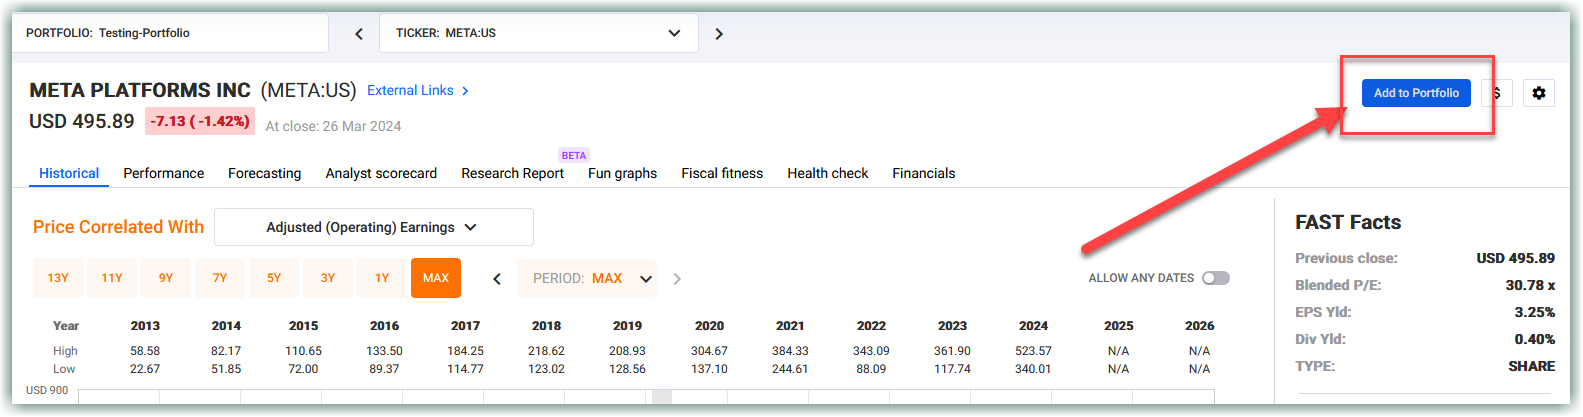
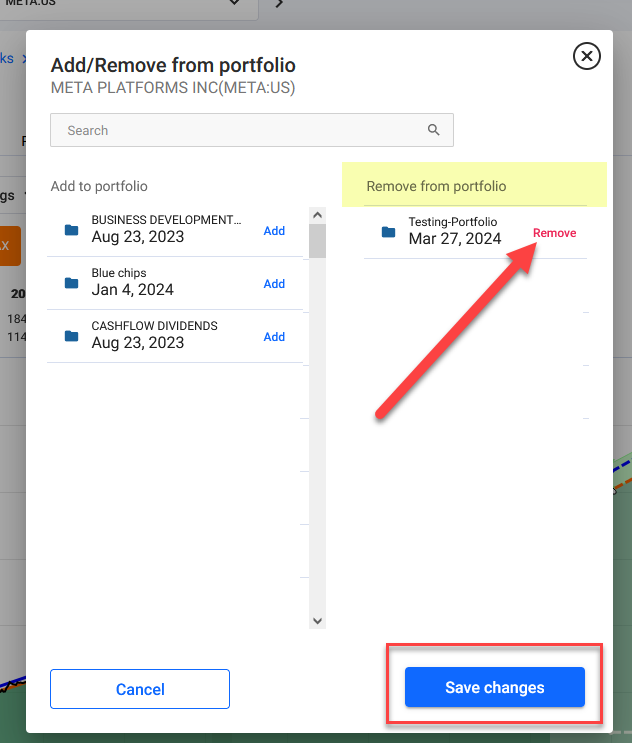
The second way to delete a ticker from a portfolio is, when viewing a graph on a company, go to the "Add to Portfolio" button in the upper right corner, click, that will produce a pop-up letting you know what portfolios, if any, you have the ticker in, OR if you want to add it to any of your portfolios. Complete by clicking "Save changes"
How To Delete A Portfolio
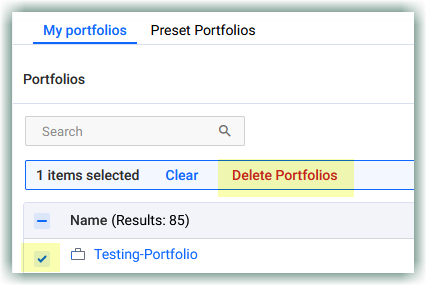
Go to "My Portfolios" - There will be a list of the portfolios you have created. To delete a portfolio, put a checkmark in the box located to the left of the name of the portfolio you want to delete, that will bring up a "Delete Portfolios" button, click that, and confirm the deletion.
Portfolio Actions Tab
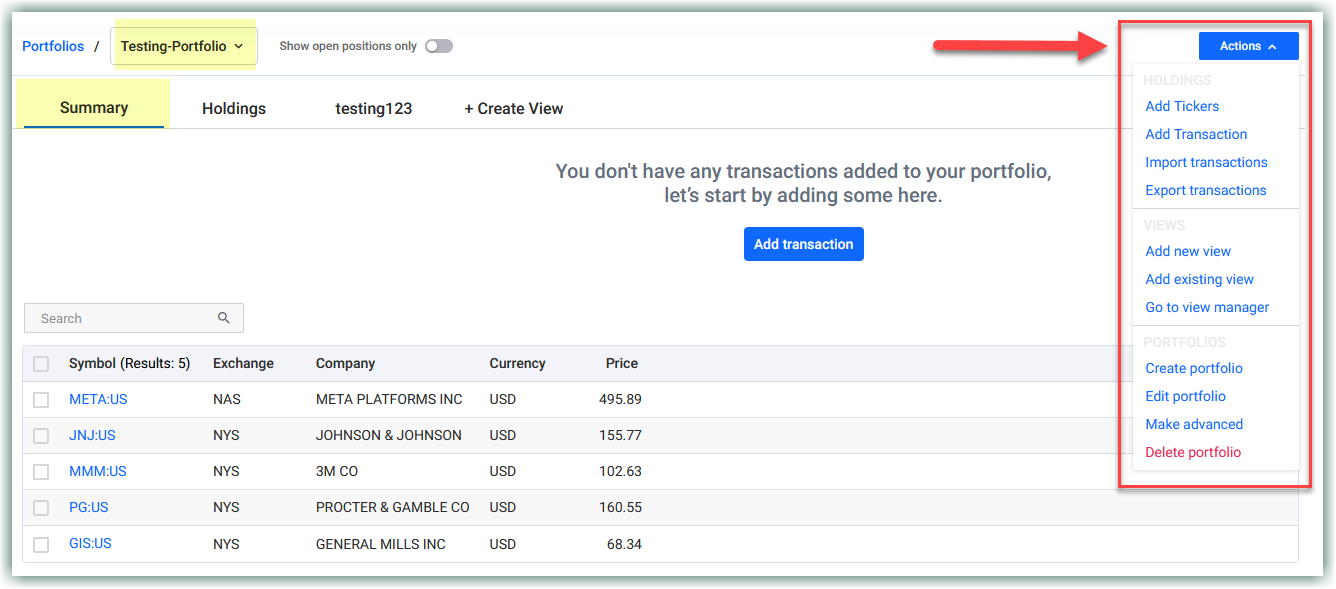
Once you click on the name of a portfolio that will take you to the "Summary" of that portfolio where you will see the name of the company, ticker, exchange, currency and price. This will also bring up an "Actions" tab where you can "add Ticker" - "Import transactions" - "Export transactions" - on Views you can "Add new view" - "Add existing view" - "Go to view manager" - and "portfolios" where you can "Create portfolio" - "Edit portfolio" - "Make advanced" and "Delete portfolio"
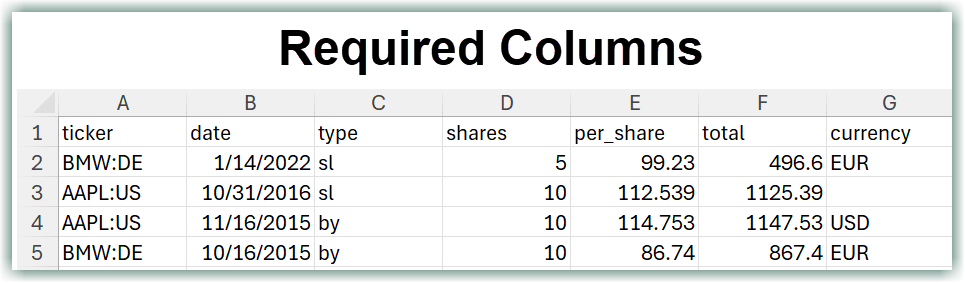
How To Import Transactions Into FAST Graphs
Your excel sheet must have these first six (6) columns - "Currency" column is optional
Instructions
Video - How To Import Transactions Into FAST Graphs
Transactions
To help track your investments, you can add buys and sells to your portfolios.
When you add buy and/or sell transactions, they will show up on the Historical Graph and Forecasting Calculators as buy (green) and sell (red) dots and display a calculated average cost line. With this, you can compare your cost basis to the stock price.


Add a Transaction
To add a transaction, go to your "Holdings" tab.
From here you can use the "Import Transactions" button and import your buys and sells, or you can click the "Transactions" icon to the right of each company and add the information in.
To Add a Transaction, click the transactions icon for the ticker, a pop-up will appear with five fields:
- Date
- Buy/Sell
- Shares
- Per Share
- Total
First add your date, buy or sell, how many shares, per share number, it will auto-populate the total by clicking in the box, then click "Add New Transaction"

Once you have added your transactions, simply "X" out of the pop-up window, that will take you back to "Holdings."
Now click the ticker symbol of the buy and/or sell that you just inputted and that will take you to the Historical Graph where you will be able to see the green buy dot and/or the red sell dot.

Edit Transactions
You can add to or edit the transactions of that specific stock in that specific portfolio by clicking on the dollar sign "$" in the upper right corner. The same pop-up as described will appear where you can Edit, Delete, and/or Add a New Transaction.
REMEMBER: In order to see your buys and sells, you must be in the specific portfolio that you added those transactions in.
Updated 15 days ago