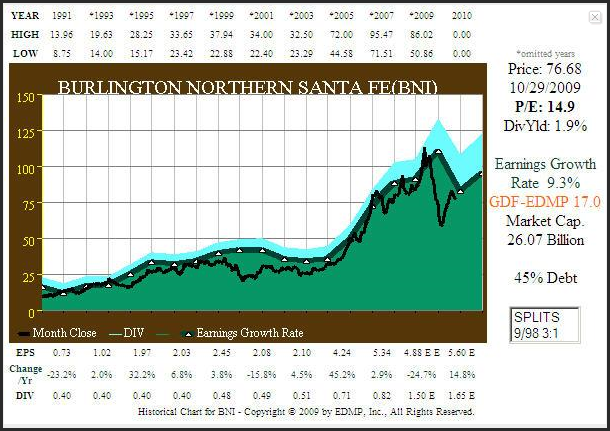
In late October/early November of 2009, Warren Buffett announced that Berkshire (BRK.A) was purchasing Burlington Northern Santa Fe Railroad (BNI). At the time, Burlington Northern Santa Fe was trading at just under 15 times earnings and offered a dividend yield of 1.9%. Even so, Warren Buffett received mixed reviews from the media. Some even went so far as to question whether or not he had lost his touch. The F.A.S.T. Graphs™ below illustrates the earnings and price correlated relationship that Burlington Northern Santa Fe Railroad possessed at the time.
Based on this Graph (note that the green line represents the earnings growth valuation line on this older version), we felt that this decision was vintage Buffett assuming that he expected the recovery in earnings that 2010 brought. Although the price fell before earnings did, the correlation between the two is clearly depicted in the price-earnings correlated Graphs. What is also clear from the graph is that price overshot the drop in earnings indicating extreme undervaluation. Therefore, one might assume that Warren Buffett recognizing a great bargain, responded accordingly, and bought the whole company.
Click to enlarge
A little over a year later
Utilizing our research tool, the following analysis looks at how five major railroads were priced at year-end 2009, just after Buffett bought Burlington Northern, followed by what they look like now, just a little under a year later. For each company we will present a historical graph ending in calendar year 2009 which is approximately a month after Warren Buffett bought Burlington Northern Santa Fe. Next, we will present a historical graph updated to current time and then a five-year forecasting graph based on consensus earnings estimates by leading analysts reporting to either FirstCall or Zacks.
This analysis begs the questions of whether Warren Buffett was exercising his great skill as a value investor, where he recognized the extraordinary value this industry then possessed, or did he instigate the strong rally in this sector since, by rousing others to copy his behavior? The Graphs updated to current time also provide insight into the opportunities created by undervaluation preceding an earnings recovery.
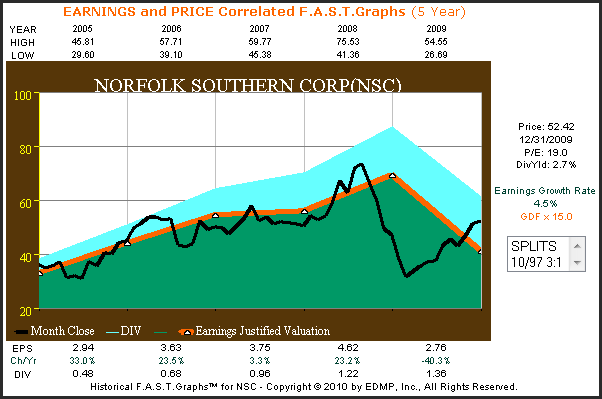
Norfolk Southern Corp. (NSC), 2005 through year-end 2009
Our first example, Norfolk Southern Corp. shows earnings falling by over 40% in calendar year 2009 with stock price preceding the earnings decline by falling over 60% before recovering by year-end. In this example, this premature recovery might be attributed to the fact that Norfolk Southern Corp. maintained and then increased its dividend in 2009.
Click to enlarge
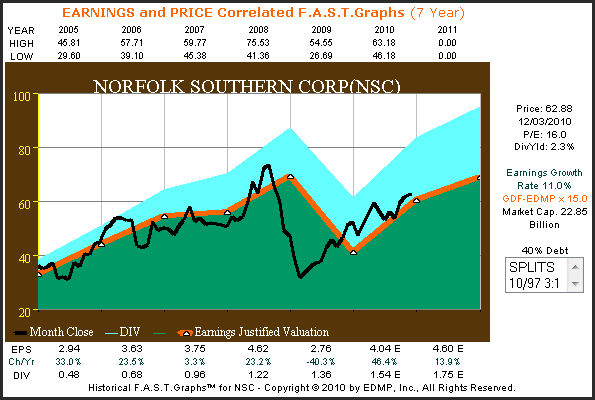
Norfolk Southern Corp., 2005 through December 6, 2010
The updated graph below shows that stock prices continued to rally and advanced throughout calendar year 2010. It also shows that at 16 times earnings with a 2.3% dividend yield that the stock is fairly valued to only modestly overvalued currently.
Click to enlarge
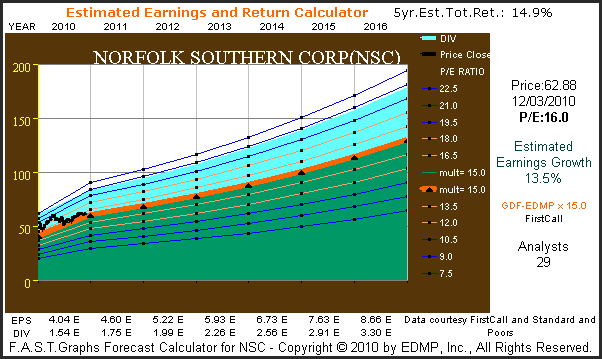
Norfolk Southern Corp. consensus five-year earnings estimator calculator
The five-year earnings estimator and return calculator below indicates the company to be attractively valued based on the consensus five-year earnings growth forecast of 13.5% by 29 analysts reporting to FirstCall and applying the GDF-EDMP modified formula for valuing a business. If the company were to achieve this earnings growth and the market capitalized those earnings at the implied fair value PE ratio of 15, then the expected five-year estimated compounded annual return would equal 14.9% including dividends.
Click to enlarge
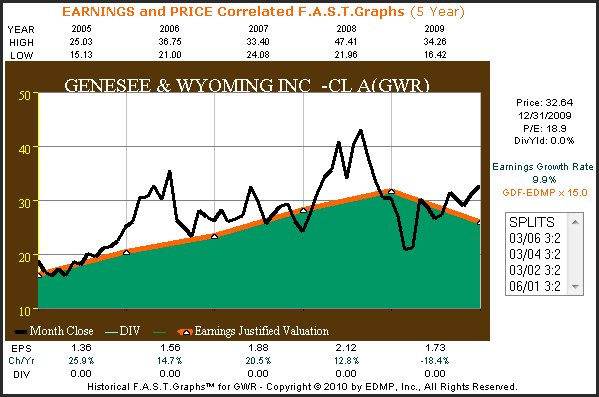
Genesee & Wyoming (GWR), 2005 through year-end 2009
Genesee & Wyoming looked very overvalued in the fall of 2008, before the stock price reverted to the mean by returning to the orange earnings justified valuation line, and then falling significantly below it before recovering by year-end.
Click to enlarge
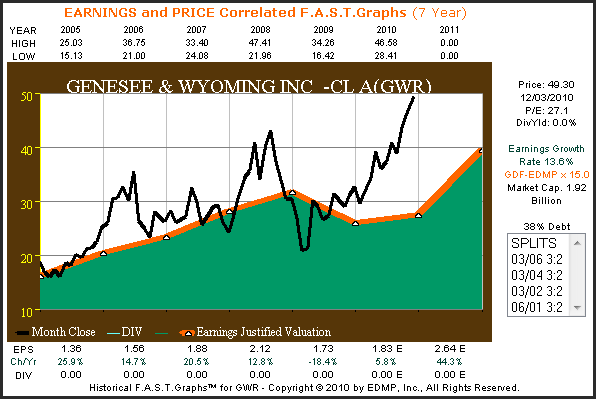
Genesee & Wyoming, 2005 through December 6, 2010
The updated graph below shows that Genesee & Wyoming’s stock price almost tripling off of its lows set in 2009. However, the current price-earnings ratio of 27.1 appears very high.
Click to enlarge
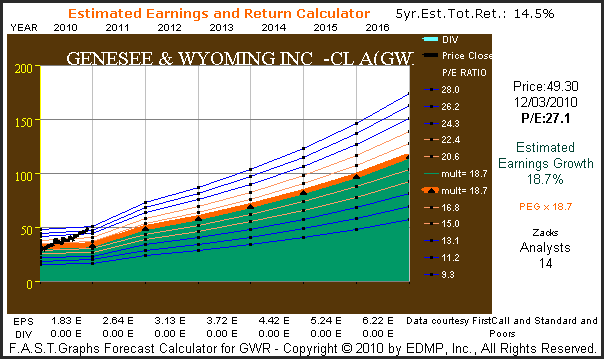
Genesee & Wyoming consensus five-year earnings estimator calculator
The five-year earnings estimator and return calculator below indicates the company to be moderately overvalued based on the consensus five-year earnings growth forecast of 18.7% by 14 analysts reporting to Zacks and applying the PEG (price equals growth rate) formula for valuing a business. If the company were to achieve this earnings growth and the market capitalized those earnings at the implied fair value PE ratio of 18.7, then the expected five-year estimated compounded annual return would equal 14.5% even without dividends.
Click to enlarge
Three more examples with dividend kickers
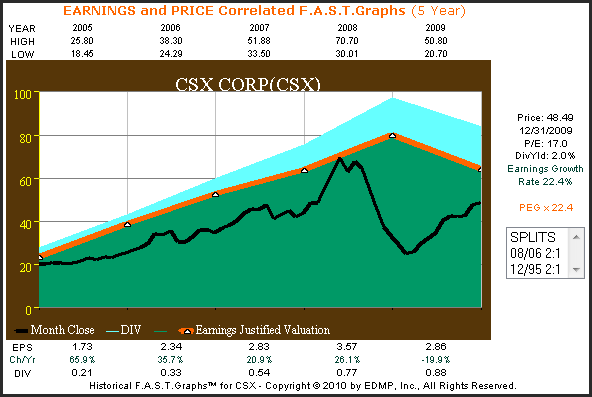
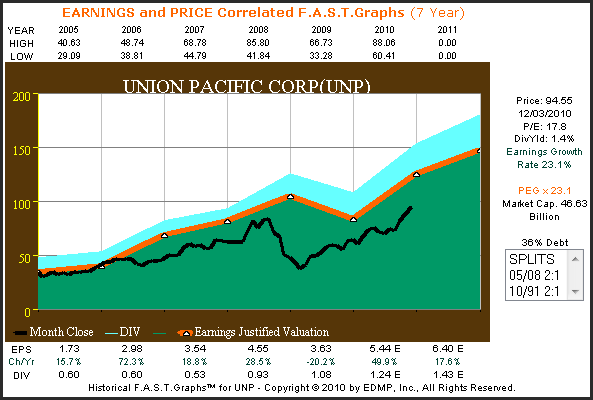
Our next three examples offer very similar, but not identical, price-earnings correlated graphs. With each example, note how the stock price drop preceded earnings drops and then recovered dramatically as earnings recovered and dividends were maintained and increased. Also, each example appears reasonably priced today based on consensus earnings forecasts going forward. Union Pacific may be slightly overvalued, but only slightly.
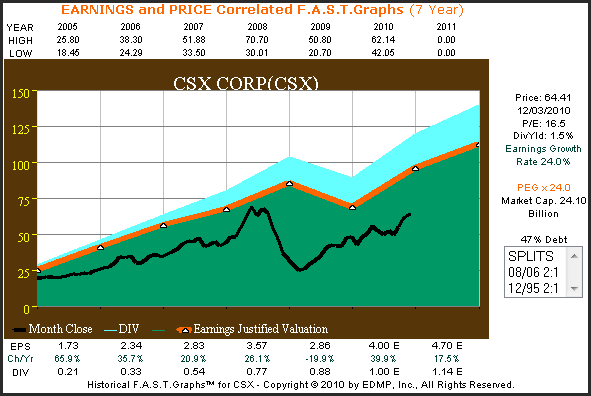
CSX Corp. (CSX), 2005 through year-end 2009
Click to enlarge
CSX Corp., 2005 through December 6, 2010
Click to enlarge
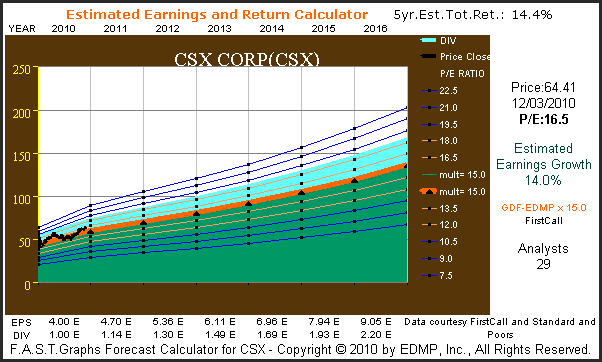
CSX Corp. consensus five-year earnings estimator calculator
Click to enlarge
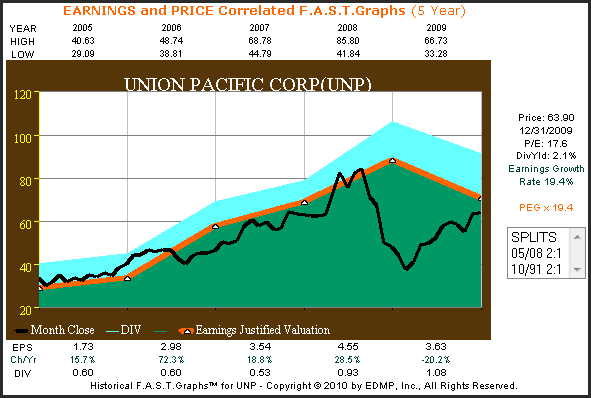
Union Pacific Corp. (UNP), 2005 through year-end 2009
Click to enlarge
Union Pacific Corp., 2005 through December 6, 2010
Click to enlarge
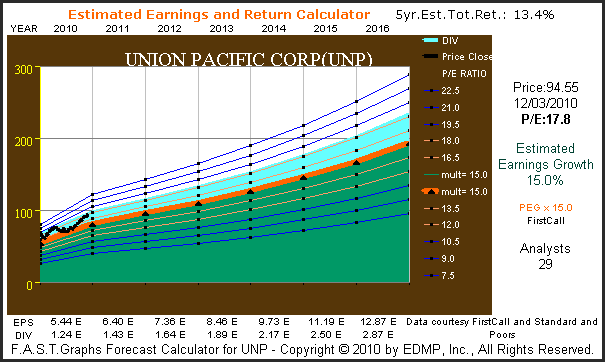
Union Pacific Corp. consensus five-year earnings estimator calculator
Click to enlarge
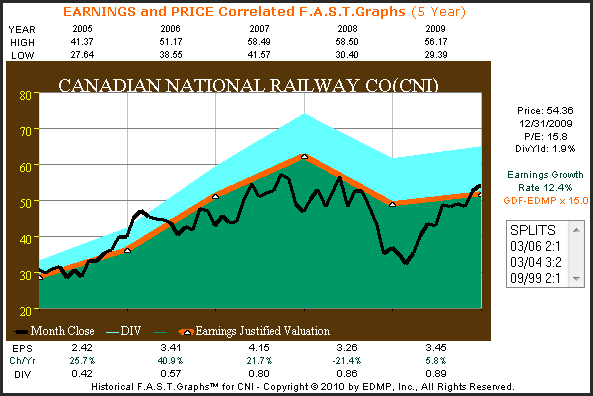
Canadian National Railway Co. (CNI), 2005 through year-end 2009 Historical F.A.S.T. Graphs™
Click to enlarge
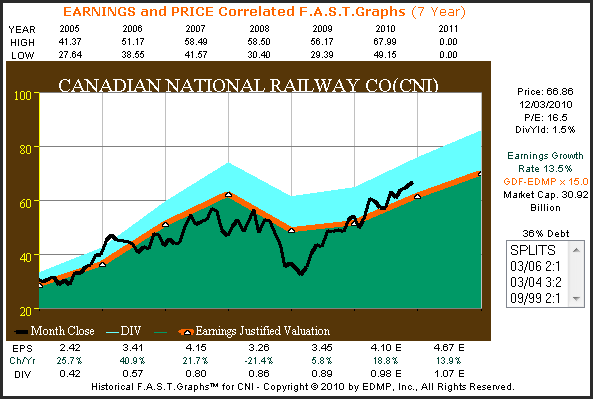
Canadian National Railway Co., 2005 through December 6, 2010
Click to enlarge
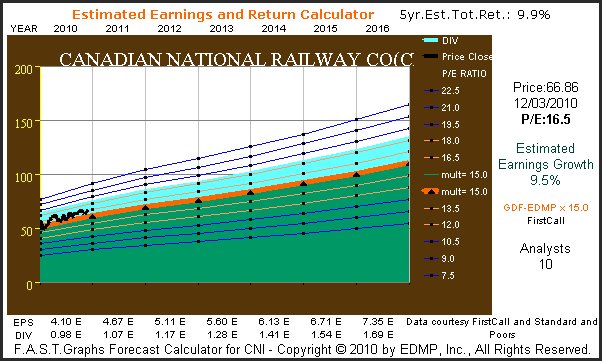
Canadian National Railway Co. consensus five-year earnings estimator calculator
Click to enlarge
Conclusions
As the above graphs illustrate, railroad stocks have been on a tear since Warren Buffett made his much ballyhooed purchase of Burlington Northern Santa Fe. Frankly, the valuations of railroad stocks in general at that time appeared very attractive, even based on depressed earnings caused by the great recession. Although earnings were depressed, they remained relatively strong, all things considered. Warren Buffett never lost faith in America, and was willing to put his money where his faith rested. His “Buy American I Am” piece he authored for The New York Times, just before he announced his purchase of Burlington Northern, expressed his conviction.
Warren Buffett’s idea that “fear is the foe of the faddist, but the friend of the fundamentalist” seems to have paid off. Keeping emotions in check during periods of extreme economic stress, like those experienced in 2009, is very difficult. On the other hand, when cool heads prevail and analysis is based on reason and common sense, extraordinary profits can be had. As Warren Buffett also says “be greedy when others are fearful, and fearful when others are greedy.” It certainly seems to work for him. Now it’s up to each investor to choose for themselves whether or not they want to ride the rails along with Warren Buffett today. Hopefully, the above analysis provides some insight.
The opinions in this document are for informational and educational purposes only and should not be construed as a recommendation to buy or sell the stocks mentioned or to solicit transactions or clients. Past performance of the companies discussed may not continue and the companies may not achieve the earnings growth as predicted. The information in this document is believed to be accurate, but under no circumstances should a person act upon the information contained within. We do not recommend that anyone act upon any investment information without first consulting an investment advisor as to the suitability of such investments for his specific situation.