It seems like the debate regarding the merits of the “buy-and-hold” investing strategy is alive and well. We always find these discussions amusing, because we believe that it is such a pointless discussion. There is no general argument or case that can be made to support the buy-and-hold strategy or to negate it.
The only true answer to the buy-and-hold argument is it depends on what and/or when you buy-and-hold. If you buy the right company at the right price, then buy-and-hold is a great strategy. If you buy the wrong company at any price, then the buy-and-hold strategy is a dumb move. Also, if you buy the right company at the wrong price, then buy-and-hold would once again be a bad move.
General considerations
After the market crash of 2008 it seemed like buy-and-hold bashers came out of the woodwork. Everyone was pointing to the so-called lost decade to validate their thesis that buy-and-hold was a dumb move. In this era of day trading mania where investors are more inclined to own a common stock for mere minutes rather than years, many pundits and investors alike jumped on the anti-buy-and-hold bandwagon.
One critical point that we want to make early is that buy-and-hold is an investing strategy. Investing strategies by definition imply a long holding period. Speculation, on the other hand, implies shorter time frames where the speculator is attempting to exploit an arbitrage situation. Our point is not to debate the virtues of one over the other, our desire is to point out that investing and speculating are not the same thing.
As an investing strategy, there is an old adage that supports the virtue of being a buy-and-hold investor: “a portfolio is like a bar of soap, the more you handle it the smaller it gets.” The true investor is looking for a place where they can allocate their capital in order to receive an attractive return on their capital at appropriate levels of risk. The higher the return they attempt to achieve, the higher the risk they’re willing to take, and vice versa.
Another general comment to be made about buy-and-hold as an investment strategy refers to investors who are looking to generate income from their investments. Income investors have the option of either fixed income, i.e., bonds, annuities and CDs, etc.; or income producing equities, i.e., real estate, dividend paying common stocks, etc. Of course, they can invest in these asset classes separately or in packages like mutual funds, MLPs, REITS or ETF’s, etc. These investments need to be owned for long periods of time if any harvesting of interest or dividends is to occur.
The many faces of buy-and-hold
The remainder of this article will look at situations where buy-and-hold is a great strategy as well as situations where it’s not. For the sake of efficiency we will present these discussions in graphic form through the lens of our F.A.S.T. Graphs™ research tool.
Overvaluation caused the lost decade
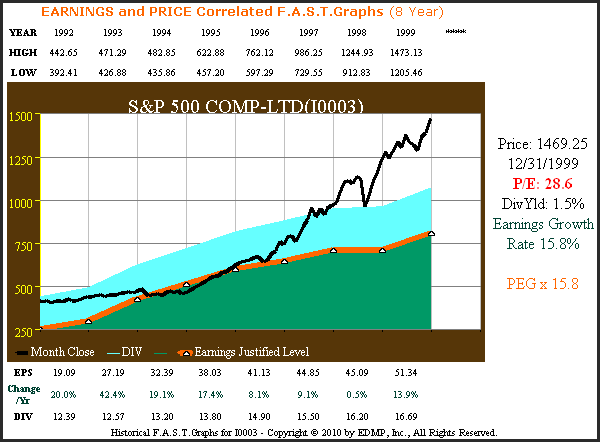
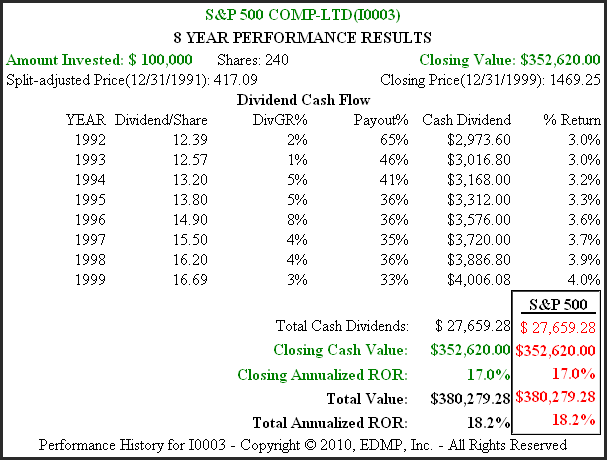
The following F.A.S.T. Graphs on the S&P 500 show the importance of valuation regarding a buy-and-hold strategy. The first set of graphs plots the S&P 500 stock price correlated to earnings for the period 1992 through 2009 and the corresponding performance over this timeframe. There are two important takeaways from these graphs: 1. Earnings growth for the S&P 500 over this time period was exceptionally high at 15.8%. 2. The year ending December 31, 1999, P/E ratio of 28.6 is close to double the historical normal S&P 500 P/E ratio of 15 indicating excessive overvaluation.
S&P 500 1992 to 1999 earnings to price
click to enlarge
S&P 500 1992 to 1999 performance
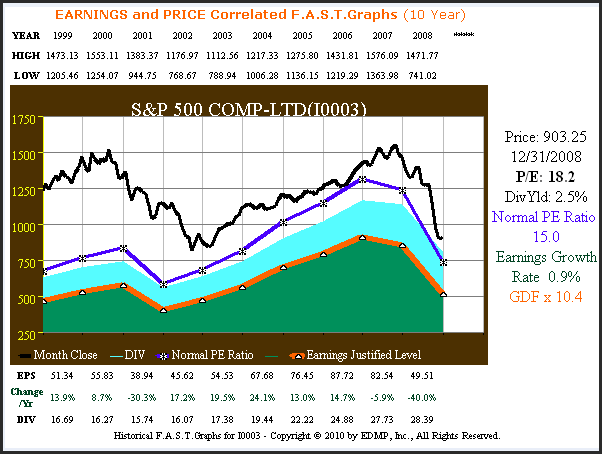
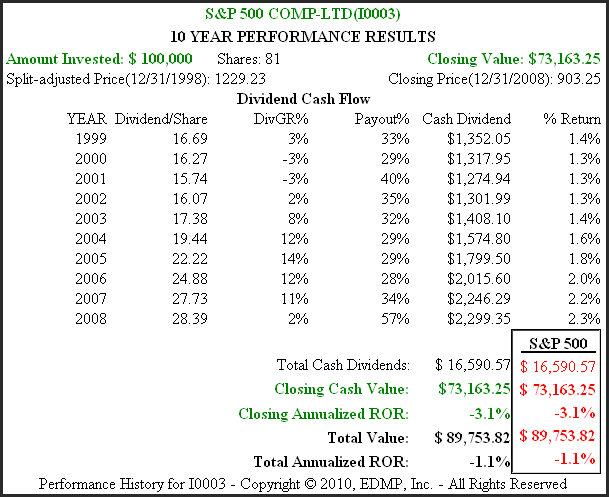
This next set of graphs on the S&P 500 covers the timeframe calendar year 1999 through 2008. These graphs cover the period most often referred to as the lost decade. Even though it includes the recessions of 2001 and the great recession of 2008, it is clear from this chart that overvaluation was the major cause of investor losses. Also note that earnings growth for the S&P had fallen to a historically low .9% per annum. We have added the normal 15 PE Ratio line (blue line with asterisk) to provide a clear perspective of the normal historical valuation for the S&P 500.
S&P 500 1999 to 2008 earnings to price
Overvaluation casued the lost decade
S&P 500 1999 to 2008 performance
From the above set of four graphs on the S&P 500 it is clear that buy-and-hold was an excellent strategy for owning the S&P 500 over the period 1992 to 1999. Notice that valuation was a little high at the beginning date and it was excessively high at the ending date. Also, earnings growth was abnormally high for this index. Therefore, it all added up to extraordinary returns for S&P 500 buy-and-hold investors.
In contrast, due to excessive overvaluation and poor operating results due to two recessions, the time period 1999 to 2008 was a horrible time to be a buy-and-hold investor. Note however, that overvaluation had more impact on shareholder losses than poor operating results. A lot of arguments either for or against buy-and-hold utilize measurements of performance based solely on stock price. We contend that measuring performance without simultaneously measuring valuation is a job half done.
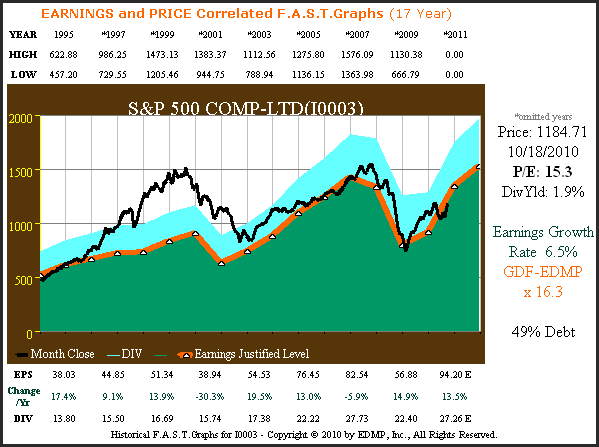
The S&P 500 is an important index and is often considered a proxy for the general market. The following graphs on the S&P 500 offer a look during a timeframe where both starting and ending valuation were normal at 15 times earnings. Over this 16 3/4 year time frame a lot occurred including, periods of significant overvaluation, two recessions, etc. Yet, what is crystal clear is that long-term performance not only correlated closely to earnings, but is also clearly a function of earnings as long as valuation is sensible. Therefore, the closing annualized ROR of 6.1% correlates very closely to the earnings growth rate of 6.5%.
S&P 500 17yr. earnings to price
S&P 500 17yr. performance
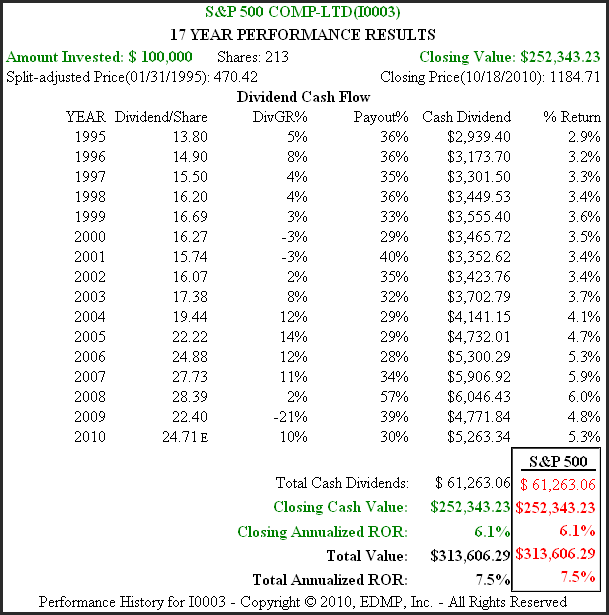
Over the calendar year 1995 to current timeframe, owners of the S&P 500 when purchased at True Worth™ value and held until today, where True Worth™ value once again is manifest, received returns that were consistent with operating results. If you are going to be a buy-and-hold investor, it is imperative that the principles of valuation as they relate to earnings (operating results) is understood, respected and investment buy/sell decisions are properly executed accordingly.
When growth and value are aligned
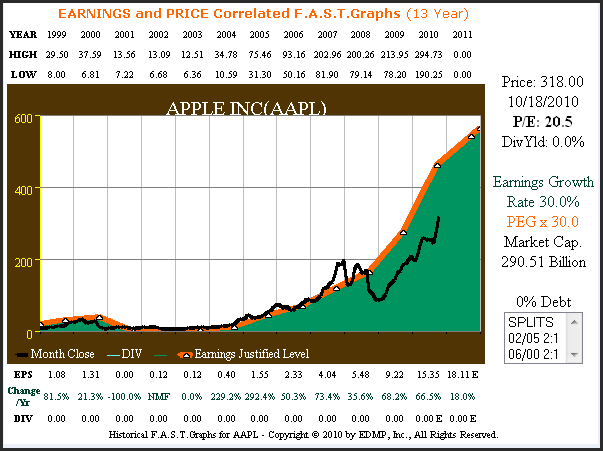
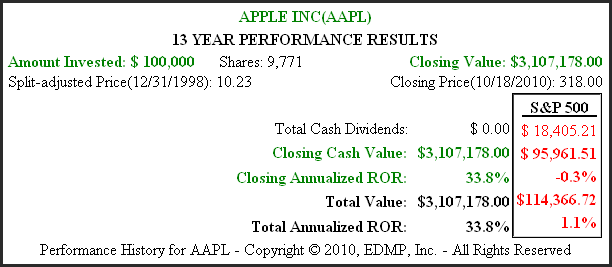
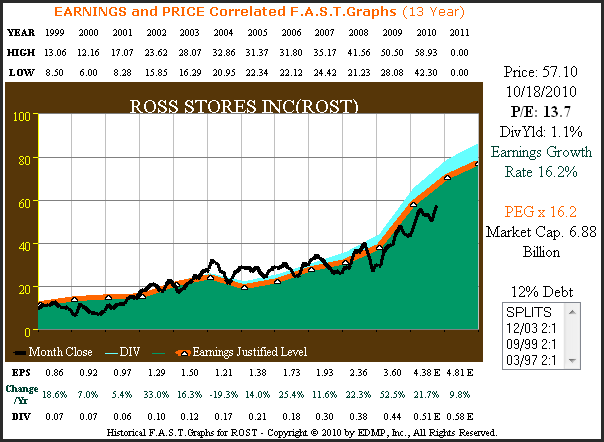
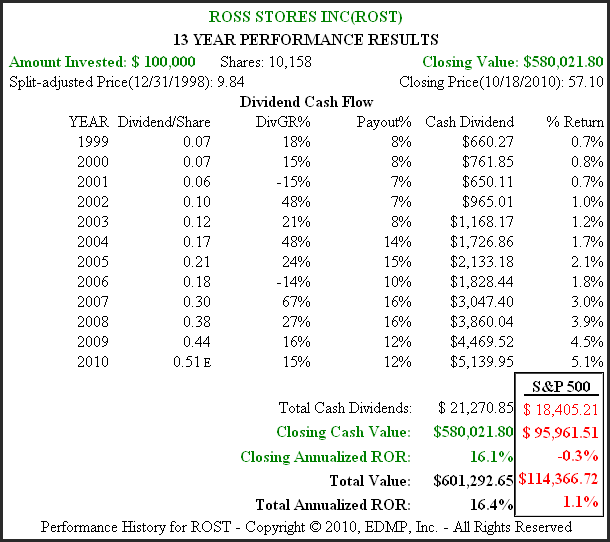
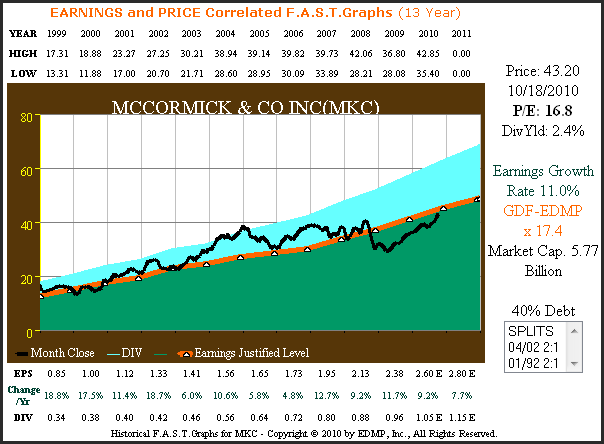
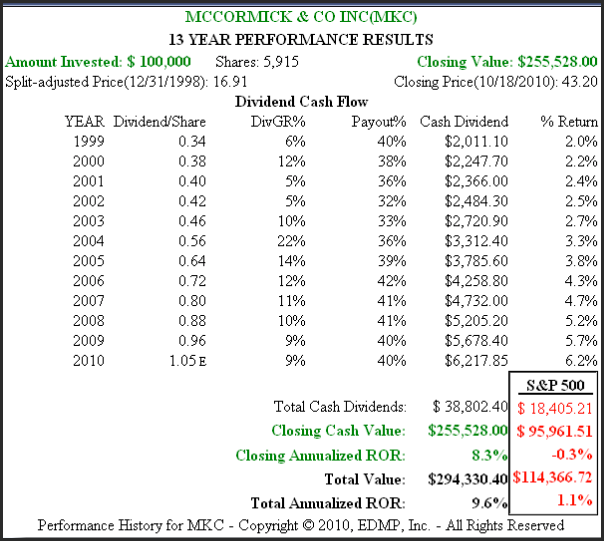
The next series of graphs portrays three companies over the timeframe 1999 to current, that illustrate how effective a strategy buy-and-hold can be. At varying degrees, each of these companies possess extremely consistent and strong earnings growth, and each was reasonably valued at the beginning date of this time period. Our first choice, Apple Inc. (AAPL), provides an example of a pure growth stock. Our second choice, Ross Stores (ROST), provides an example of a growth stock with a dividend component. Our third and final choice, McCormick & Co. (MKC), provides an example of a dividend aristocrat growth and income stock.
Each of these examples provide undeniable evidence that a buy-and-hold investing strategy works extremely well when the right companies are originally purchased at the right valuations. We see this as compelling evidence that the buy-and-hold strategy, done right, is a great and prudent way for people to invest.
AAPL 13yr. Earnings & Price Correlated
AAPL 13yr. Performance
ROST 13yr. Earnings & Price Correlated
ROST 13yr. Performance
MKC 13yr. Earnings & Price Correlated
MKC 13yr. Performance
When buy-and-hold is a dumb move
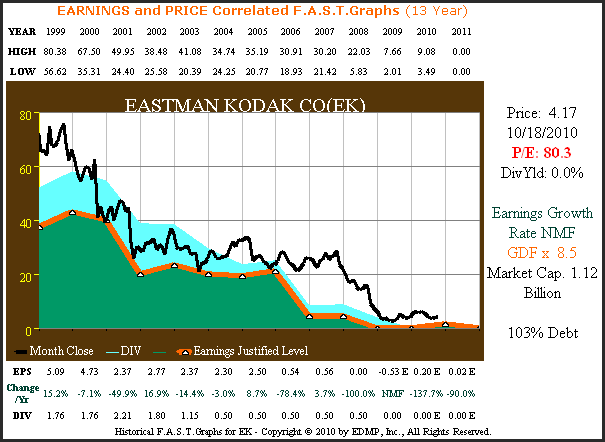
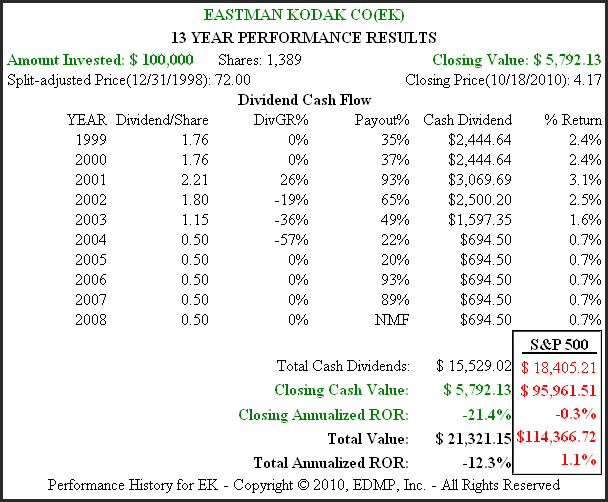
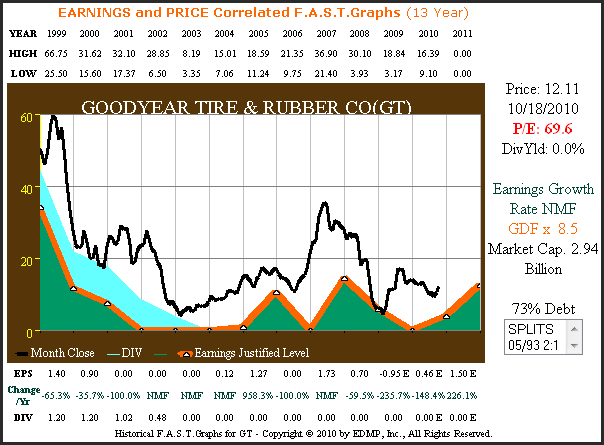
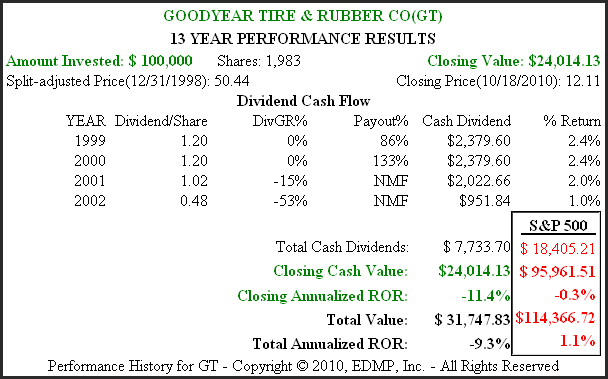
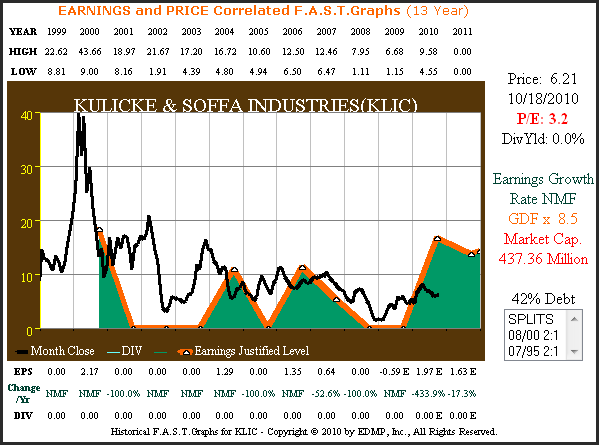
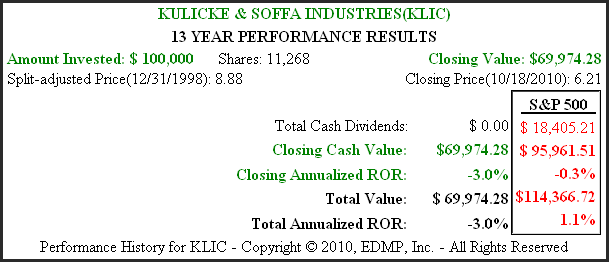
The next series of graphs portrays three companies over the timeframe 1999 to current that illustrate when buy-and-hold is a dumb move. Valuation does not really apply in these examples as it all comes down to terrible operating results. We will let the graphs speak for themselves and as you will see that collapsing earnings and/or very cyclical earnings growth does not work with a buy-and-hold approach. Why would anyone have wanted to buy-and-hold these three companies since calendar year 1999? The question is rhetorical because the answer is so obvious.
EK 13yr. Earnings & Price Correlated
EK 13yr. Performance
GT 13yr. Earnings & Price Correlated
GT 13yr. Performance
KLIC 13yr. Earnings & Price Correlated
KLIC 13yr. Performance
Even the best can be dangerously overvalued
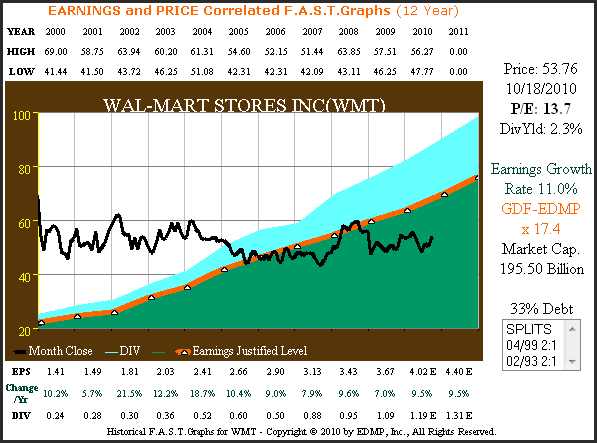
This next series of graphs illustrates how overvaluation can destroy buy-and-hold returns for even the best of companies. Our first example looks at Wal-Mart (WMT) since calendar year 1999, and is one that we’ve written about before. At the beginning of calendar year 2000, Wal-Mart was trading at over $69 a share while True Worth™ valuation was indicated at approximately $22 a share.
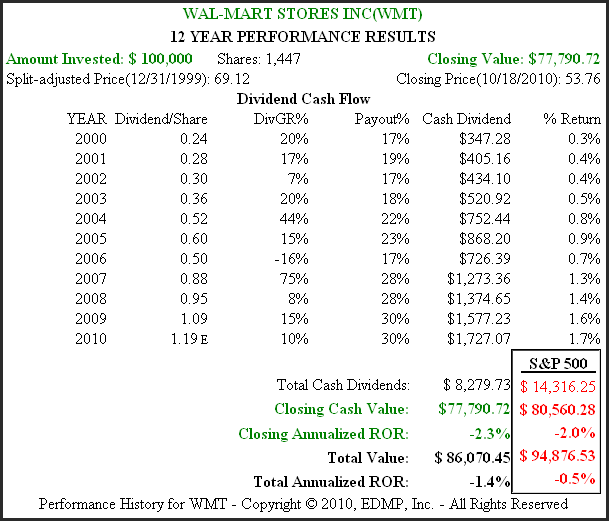
While many overvalued stocks experienced a severe and rather immediate correction in calendar year 2000, Wal-Mart’s stock price went sideways for the better part of seven years before aligning with True Worth™ valuation. Perhaps buy-and-hold Wal-Mart investors were simply unwilling to sell this great business. But notice that even though earnings growth equaled a very consistent 11%, long-term buy-and-hold shareholders lost money over this timeframe because of beginning overvaluation.
WMT 12yr. Earnings & Price Correlated
WMT 12yr. Performance
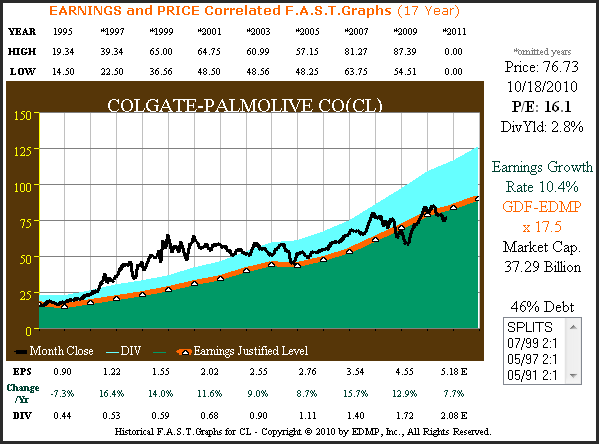
Our next example that illustrates the pitfalls of overvaluation looks at Colgate-Palmolive (CL). Our first graph looks at this blue-chip dividend paying stalwart for the period calendar year 1995 to current that correlates to our S&P 500 example above. As you can see from calendar year 1995 to calendar year 1999, Colgate-Palmolive’s stock price became increasingly more overvalued as it disconnected from its earnings justified valuation (orange line with white triangles). Like Wal-Mart, but not as extreme, Colgate’s stock price went sideways until October of 2004 until once again it touched its True Worth™ valuation line.
CL 17yr. Earnings & Price Correlated
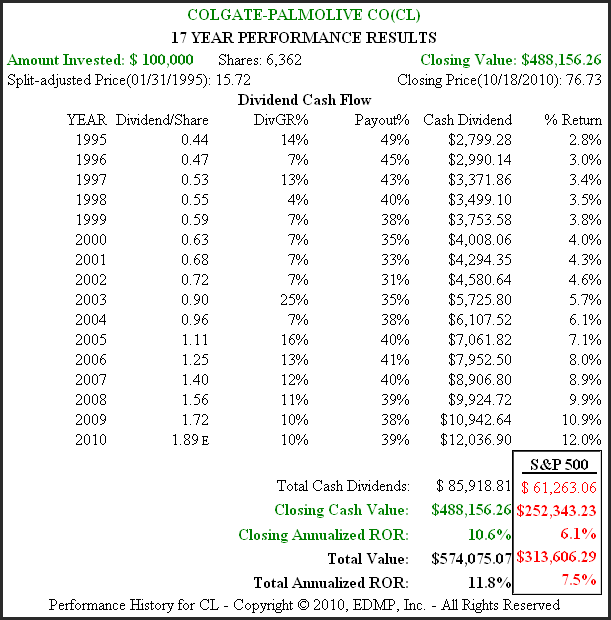
CL 17yr. Performance
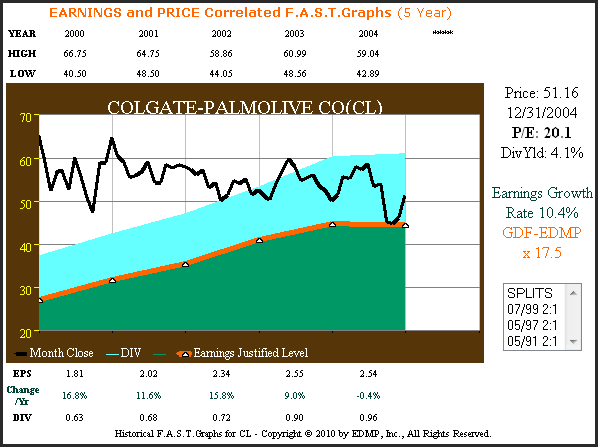
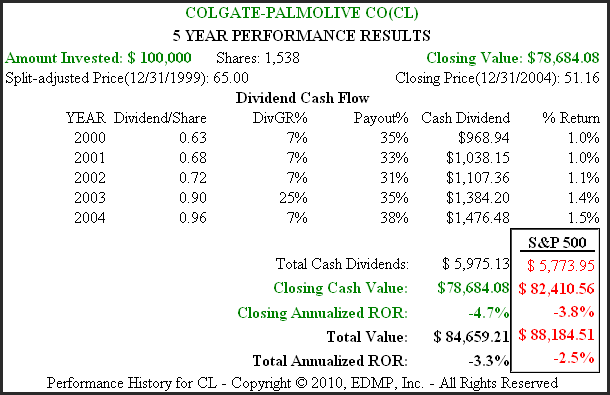
The following set of graphs review Colgate just for the overvaluation period, Calendar year 2000 through calendar year 2004. Clearly, calendar years 2000 to 2004 were not an attractive buy-and-hold timeframe for Colgate shareholders.
There are two interesting things to note on the price and earnings correlated graph. First, note how high Colgate’s stock price was relative to True Worth™ valuation at the beginning of calendar year 2000 which caused it to go sideways, not withstanding short bouts of volatility. Next, note how a modest drop in earnings in calendar year 2004 provided the catalyst to bring their stock price swiftly down into True Worth™ value.
CL 2000 to 2004 earnings to price
CL 2000 to 2004 performance
Conclusions
The main premise behind this article was to illustrate how the general arguments regarding whether buy-and-hold is a good strategy or not are frankly ridiculous. The validity of buy-and-hold as a sound investing strategy is predicated on many factors. Some of the primary ones, are what you buy-and-hold and the price at which you buy-and-hold it at. As the examples above illustrate, you can’t just buy-and-hold anything, furthermore, you can’t just buy it at any price either. For buy-and-hold to truly be an effective strategy, it has to be done right. However, when done right it is a terrific way for people to invest their capital.
A secondary premise behind this article was to illustrate the profound and fundamental difference between true investing and speculating. Buy-and-hold is an investing strategy that implies the appropriate holding time period, which is a hallmark of any strategy called investing. Speculation on the other hand is usually associated with shorter time frames where some element of arbitrage is applied. Whether speculators will admit it or not, there is more risk associated with this tactic than there is with sound fundamental investing practices like buy-and-hold.
At the end of the day, the practical application of a well thought-out and disciplined buy-and-hold strategy has proven itself and really needs no defense. In the long run buy-and-hold will be more tax efficient and less costly than more active strategies. This is not to say that more active strategies can’t be profitable, it simply means that they’re more difficult, costly and riskier to execute effectively.
Disclosure: LONG: AAPL, ROST, MKC at the time of writing. The opinions in this document are for informational and educational purposes only and should not be construed as a recommendation to buy or sell the stocks mentioned or to solicit transactions or clients. Past performance of the companies discussed may not continue and the companies may not achieve the earnings growth as predicted. The information in this document is believed to be accurate, but under no circumstances should a person act upon the information contained within. We do not recommend that anyone act upon any investment information without first consulting an investment advisor as to the suitability of such investments for his specific situation.