Introduction
In Part I of this two-part series we pointed out how proposed spending cuts by Defense Secretary Robert Gates are designed to hold the growth of the $680 billion defense department budget to only 1% or 2% for the next few years. We further pointed out that these pending spending cuts were casting a shadow of doubt on the stock prices of companies in the aerospace defense industry. Like all general statements, there is a modicum of truth in this point of view. However, like all general statements it is not 100% true.
We’ve often pointed out how dangerous it can be for investors to think in broad generalities rather than deal with specifics. Although the devil is certainly in the details, so is the extraordinary opportunity and potential reward. Therefore, rather than judge defense companies as poor investments in the general sense, this article is designed to illuminate the importance of separating the wheat from the chaff. In other words, the defense budget cut crises for the defense industry may also have created a once-in-a-lifetime opportunity to invest in select companies in this vital sector.
We are going to review 10 major players in the aerospace and defense sector through the lens of our EDMP, Inc. F.A.S.T. Graphs. We’re only going to cover defense companies that pay dividends as dividend paying investment opportunities have, of late, become of great interest to many investors. Even though each of these companies pays a dividend, you will see significant differences in their operating histories, and to a lesser extent, the dividend records of each specific company.
We are going to separate these 10 companies into two broad categories; cyclical businesses and consistent above-average growing businesses. We will examine the cyclical companies first with brief commentary on each, and then move accordingly to the consistent growers. What follows cannot be considered a thorough examination or analysis of these companies. However, we believe you will find the “essential fundamentals at a glance” perspective provided of enormous value. In an instant, we feel you will recognize how well each company has performed as an operating business within their industry and against their peers.
There are important focal points of each historical price and earnings correlated graph (A) which we would like to direct your attention to. First, see the consistency of each company’s earnings results from one year to the next and over each respective time frame measured. This is expressed as the orange line with white triangles, which we call the earnings justified value line. Second, note how the black price line follows and correlates to the earnings line. Third, the blue shaded area represents dividends which are paid out of the earnings, or green shaded area. The dividends are stacked on top for visual perspective. Finally, note the earnings growth rate that is expressed to the right side of each graph. From these earnings and price correlated graphs (A) you can visually experience the importance of earnings results to stock prices and eventually to performance to include dividends.
From each corresponding chart (B) you will see the performance including the benefit from dividends on each respective company. The important takeaway from these performance charts are how closely the total return that shareholders receive correlates to the operating performance each company achieves. Also, the effect of earnings on dividends is also very apparent.
Five dividend paying cyclical defense stocks
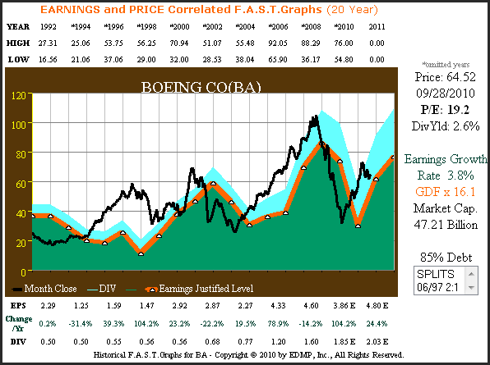
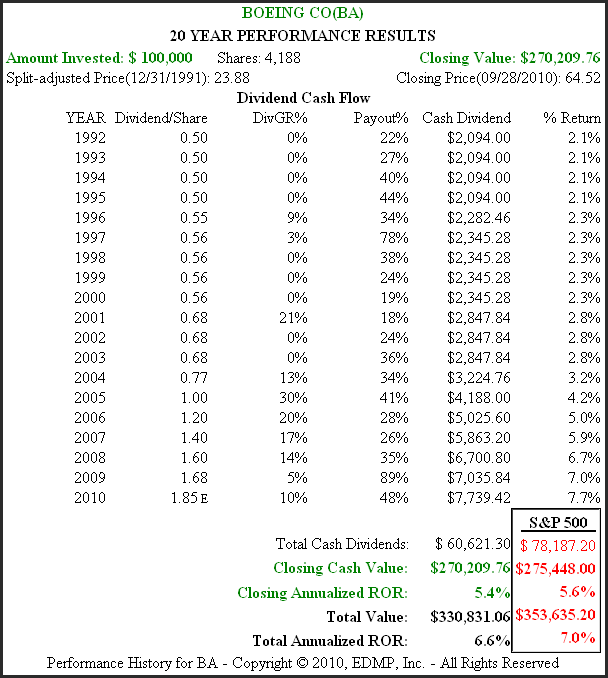
Figures 1A and B below look at Boeing Co. (BA), a leading manufacturer of commercial jet aircraft and military aircraft. As Figure 1A clearly shows, the Boeing Company’s earnings per share results are quite cyclical where earnings can fall for several years in a row, and then rise for several years in a row with no predictable pattern. Moreover, the long-term growth rate of this cyclical company has only averaged 3.8% since calendar year 1992. Also note that Boeing Co. currently trades at 19.2 times earnings and offers a dividend yield of 2.6%. However, as will be seen in Figure 1B, their dividend record of growth has been spotty.
Figure 1A BA 20yr. EPS Growth Correlated to Price BA (Click charts to enlarge)
Figure 1B below calculates the performance associated with Figure 1A. Note that Boeing Co. shareholder’s closing annualized rate of return correlates closely to the earnings per share growth rate adjusted slightly upward by high valuation. Also, as previously mentioned, the Boeing Co.’s dividend record has been spotty. Fortunately, they have not cut their dividend over this time frame, but went many years without an increase. There is also no consistency in the rate they did increase their dividends by when they did increase them.
Figure 1B BA 20yr. Performance History BA
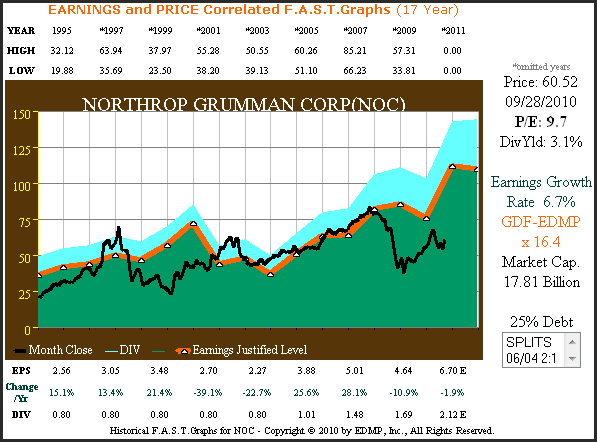
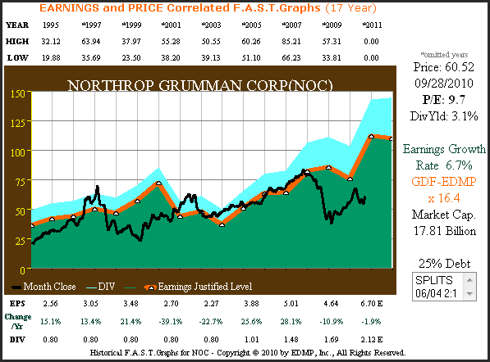
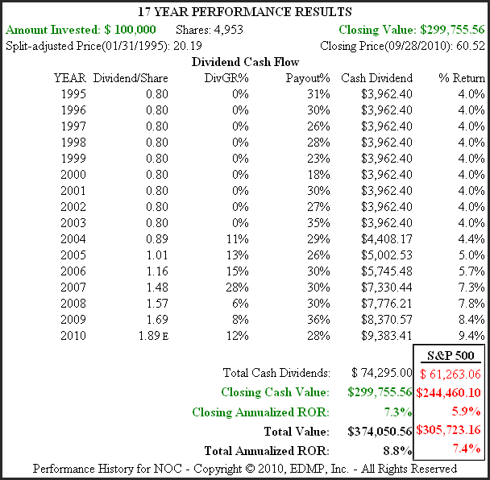
Figures 2A and B below look at Northrop Grumman Corp. (
NOC), a leading maker of airborne systems and designer of electronic warfare items, to name a few of their many aerospace and defense offerings. From Figure 2A it is apparent that Northrop Grumman, although not as cyclical as the Boeing Co. is nevertheless moderately cyclical. Earnings growth seems to come in spurts with moderate interruptions occurring from time to time. Stock price has tracked earnings reasonably well, and Northrop Grumman appears to be historically undervalued with a PE ratio of 9.7 and a dividend yield of 3.1%.
Figure 2A 17yr. EPS Growth Correlated to Price NOC)
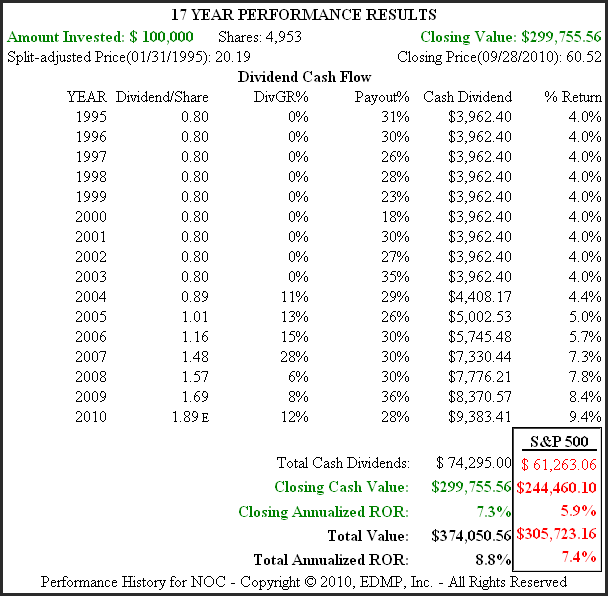
Figure 2B calculates performance associated with Figure 2A. Note how closely Northrop Grumman shareholder’s closing annualized rate of return correlates to their earnings growth rate, once again adjusted by lower starting valuation and even lower ending valuation. Although Northrop Grumman has consistently paid a dividend every year since 1995, they did not increase it until 2004. The increases in their dividend since 2004 relate to and correlate to their earnings growth over that time period.
Figure 2B 17yr. Performance History NOC
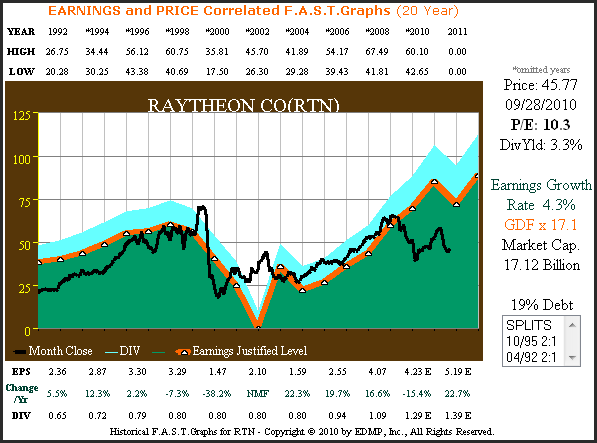
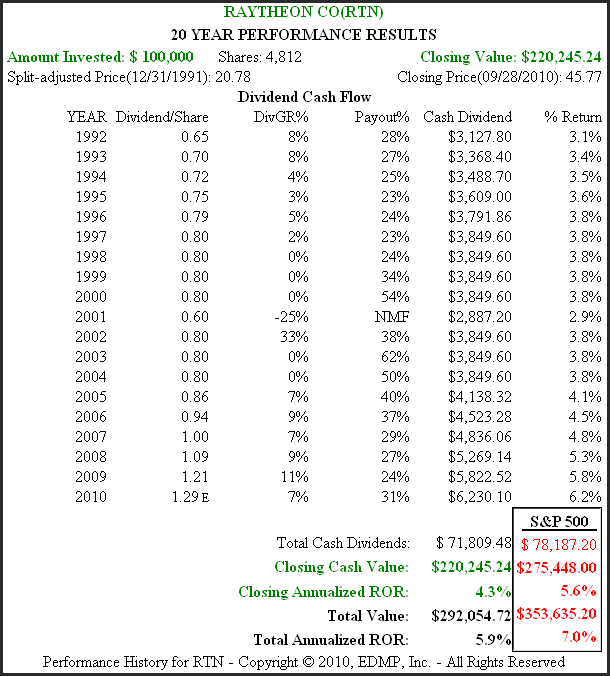
Figures 3A and 3B look at Raytheon Co. (
RTN), a global provider of air defense systems and missiles. Raytheon’s earnings record should be described as cyclical even though they have consistently increased their earnings since calendar year 2004. From the perspective of the seven-year stretch of strong earnings growth, Raytheon Company’s shares appear to be historically undervalued at a PE ratio 10.3 and a dividend yield of 3.3%. Also, their long-term earnings growth rate of 4.3% is slightly below average.
Figure 3A 20yr. EPS Growth Correlated to Price RTN
Figure 3B calculates the performance associated with Figure 3A. In Raytheon’s case, the correlation between earnings growth and the closing annualized rate of return for shareholders almost perfectly correlates at 4.3%. Their dividend record also tracks earnings very closely as the collapse of earnings for the recession of 2001 caused them to cut their dividend by 25%.
Figure 3B 20yr. Performance History RTN
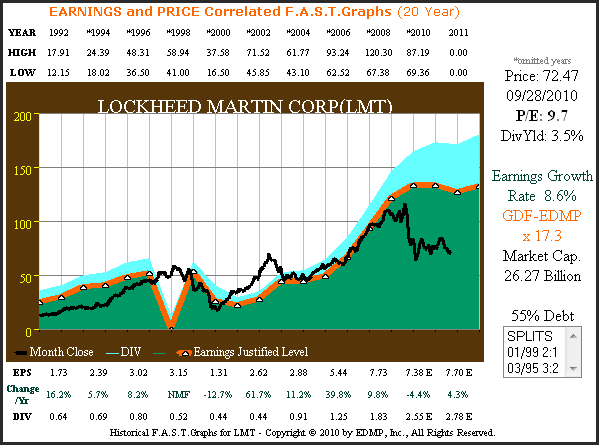
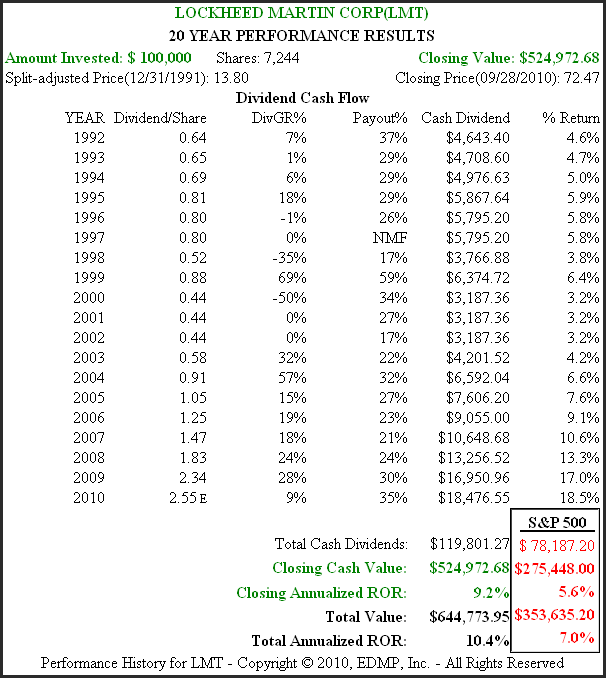
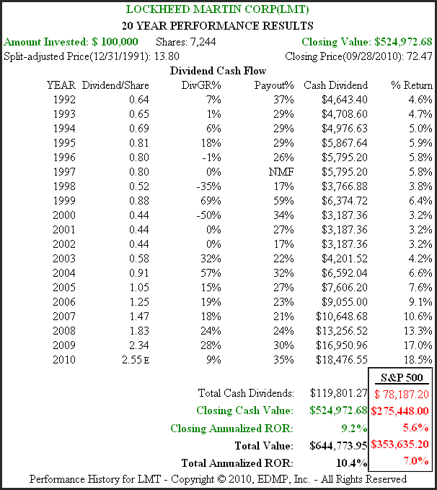
Figures 4A and 4B look at Lockheed Martin Corporation (
LMT), a leading manufacturer of electronics, aeronautics, information systems and missile systems to governments and commercial customers across the world. A review of Lockheed Martin’s earnings record depicts bouts of earnings volatility mixed in with periods of sustained growth. With a current price earnings ratio of 9.7 and a dividend yield of 3.5%, Lockheed Martin appears undervalued based on earnings growth and historically normal valuations.
Figure 4A 20yr. EPS Growth Correlated to Price LMT
Figure 4B calculates the performance associated with Figure 4A. Total shareholder returns that Lockheed Martin’s shareholders received correlates very closely to earnings growth. However, bouts of earnings cyclicality did cause them to cut their dividend on three occasions since 1992.
Figure 4B 20yr. Performance History LMT
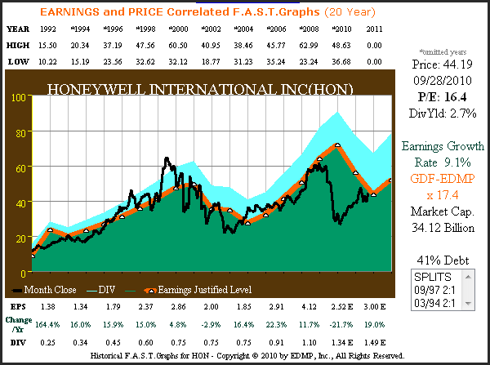
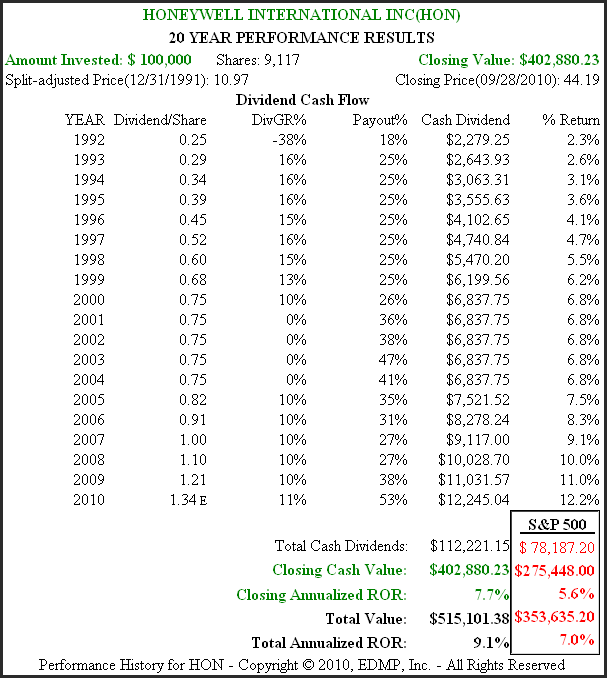
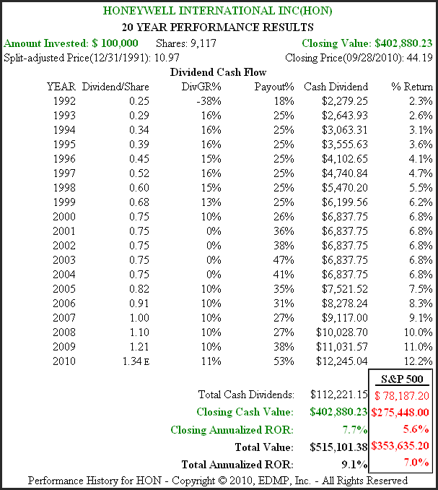
Figures 5A and B review Honeywell International (
HON), a diversified technology company with about 35% of their total sales in aerospace products. As Honeywell’s recent price correlated graph depicts, the earnings record consists of periods of sustained consistent earnings growth followed by shorter periods of earnings weakness. However, their average earnings growth rate of 9.1% is high by the standards of the other cyclical aerospace and defense companies presented in this article. With a PE ratio of 16.4, Honeywell appears to be fairly valued based on historical precedent and their earnings justified valuation.
Figure 5A 20yr. EPS Growth Correlated to Price HON
Figure 5B calculates the performance associated with Figure 5A. Honeywell’s closing annual rate of return to shareholders correlates to earnings growth, adjusted slightly downward based on modestly high valuation at the beginning timeframe 1992. They only had one dividend cut, and over the five-year period calendar year 2000 through 2004 they kept their dividend the same. Otherwise, when they did raise their dividend they were able to do it at double digit rates.
Figure 5B 20yr. Performance History HON
Summarizing the Five Cyclicals
From Figures 1A and B through 5A and B above, the long-term relationship between earnings growth, stock price movement, dividends and total return can be visually seen and understood. What each of the above five companies do have in common is the element of cyclicality in their business models. Therefore, it could be easy to draw the conclusion that the aerospace and defense industry is comprised of only cyclical businesses. Also, keep in mind that each of these companies, for the most part, operate in a similar industry and through the same economic conditions and time frames.
Five above-average growing dividend paying defense stocks
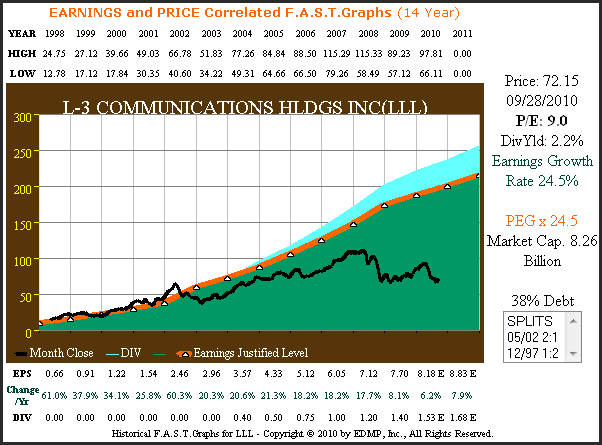
Figures 6A and 6B below look at L-3 Communications (
LLL) which was thoroughly elaborated upon in Part I of this two-part series. Therefore, we direct the reader to Part I for any additional commentary on this historically fast-growing defense company. However, note that at 9 times earnings, L-3 Communications appears to be undervalued.
Figure 6A 14yr. EPS Growth Correlated to Price LLL
Figure 6B calculates the performance associated with Figure 6A. Although L-3 Communications has only paid a dividend since 2004, the growth of their dividend has correlated very closely to the earnings growth. As previously stated in Part I of this two-part series, L-3 Communications’ strong earnings growth was able to reward their shareholders far in excess of the general stock market as measured by the S&P 500.
Figure 6B 14yr. Performance History LLL
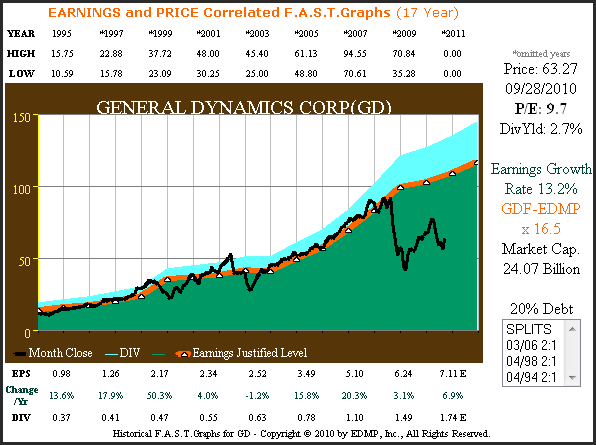
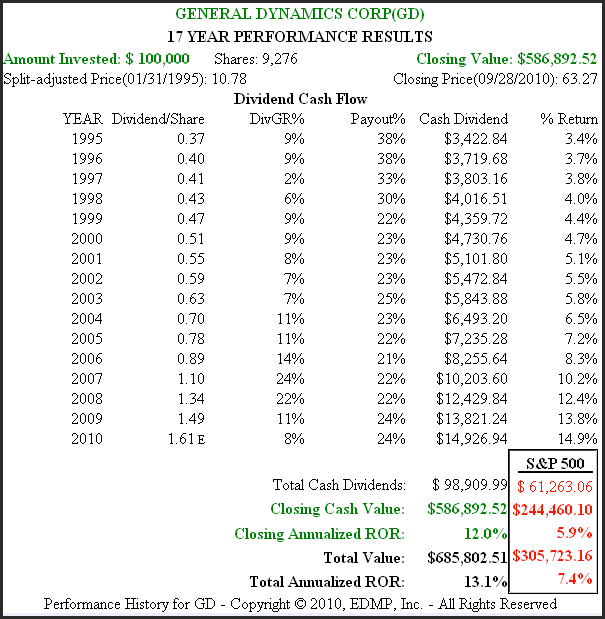
Figures 7A and B below look at General Dynamics Corp. (
GD), a leader in aerospace, combat systems, marine systems and information systems and technology. Since calendar year 1995, General Dynamics has been able to generate a very consistent record of earnings growth averaging 13.2%. Nevertheless, a slight slowdown in growth due to defense budget cuts and to a lesser extent the great recession caused what we believe to be a significant overreaction by the stock market. Consequently, we believe that General Dynamics appears historically undervalued and a PE ratio of 9.7 and a dividend yield of 2.7%. Therefore, we believe that General Dynamics represents an interesting opportunity for shareholders seeking growth of capital and an increasing dividend opportunity to research further.
Figure 7A 17yr. EPS Growth Correlated to Price GD
Figure 7B calculates the performance associated with Figure 7A. General Dynamics’ shareholders have been rewarded in conjunction with their stellar earnings record even with valuation currently so low. Their dividend record has also been consistent and growing along with their earnings.
Figure 7B 17yr. Performance History GD
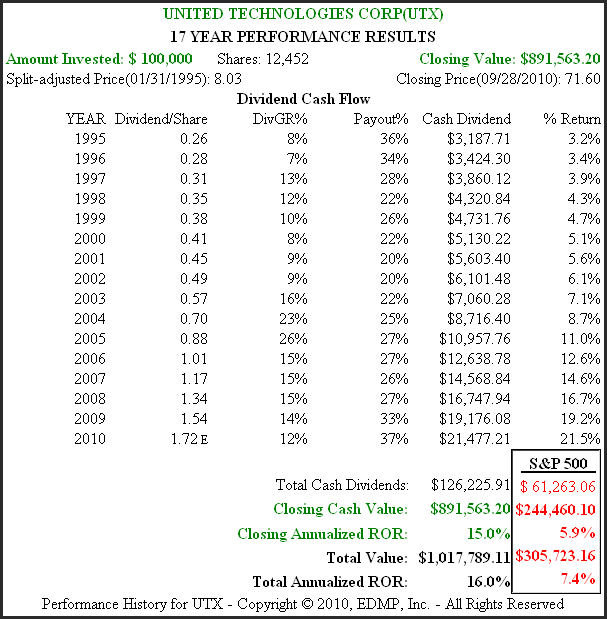
Figures 8A and 8B look at United Technologies Corp. (
UTX), a leading provider of high-tech products and services to the aerospace industry and building systems for both commercial and residential customers. United Technologies Corp. has consistently grown earnings at the above-average rate of 14% per annum. As can be seen in Figure 8A, their earnings did dip during the great recession which caused their stock price to fall dramatically but recovering earnings enabled stock price to quickly recover. United Technologies Corp. appears to be fairly valued today, with a price earnings ratio of 15.3 and a dividend yield of 2.4%.
Figure 8A UTX 17yr. EPS Growth Correlated to Price UTX
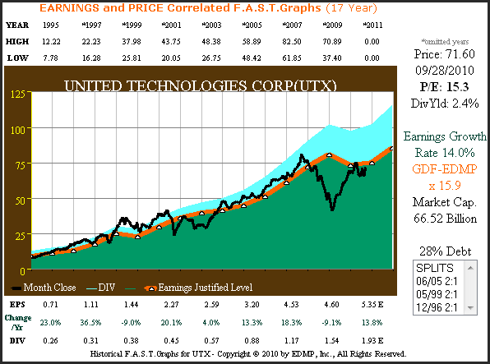
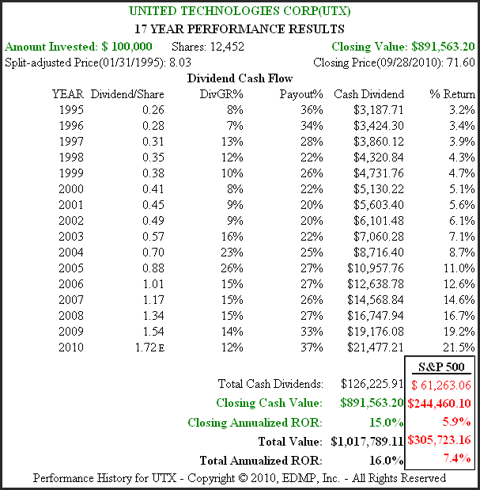
Figure 8B calculates the performance associated with Figure 8A. The shareholders of United Technologies Corp. were rewarded in direct proportion to the earnings growth that the company generated on their behalf. Additionally, again due to consistent earnings growth, United Technologies Corporation was able to raise their dividends at double-digit rates on average since calendar year 1995.
Figure 8B 17yr. Performance History UTX)
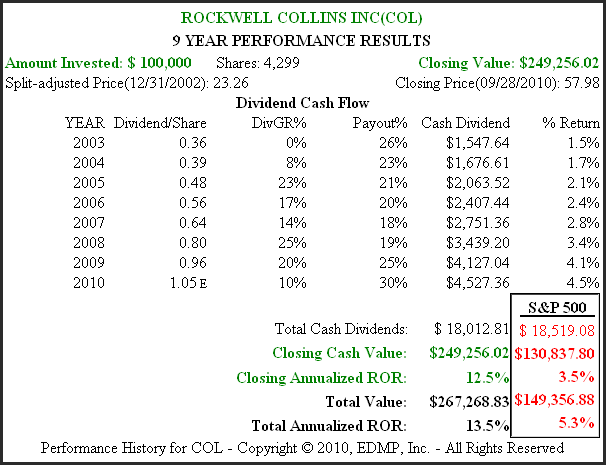
Figures 9A and 9B look at Rockwell Collins Inc. (
COL), since calendar year 2003. Rockwell Collins was spun-off from Rockwell Automation on June of 2001, the company designs and manufactures mobile and airborne communication systems and supports the electronics that go into those systems. Figure 9A shows that their operating record over their short existence as an independent company has been consistent and strong. Rockwell Collins has generated above-average results with earnings growing at 13.8% a year. Rockwell Collins Inc. appears to be fairly valued with a PE ratio of 16.5 and a starting dividend yield of 1.7%.
Figure 9A 9yr. EPS Growth Correlated to Price COL
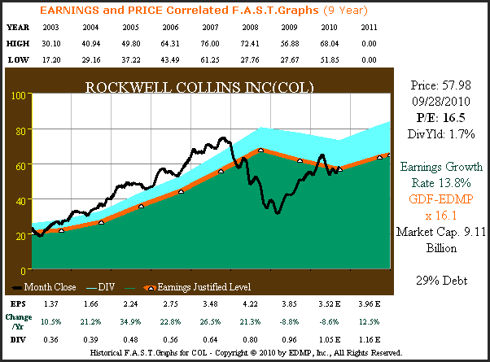
Figure 9B calculates the performance associated with Figure 9A. Once again, Rockwell Collins represents an example of the
strong correlation between a company’s earnings growth and stock price over time. Also, since calendar year 2004, Rockwell Collins has increased the dividend they pay their shareholders consistent with their earnings growth.
Figure 9B 9yr. Performance History COL

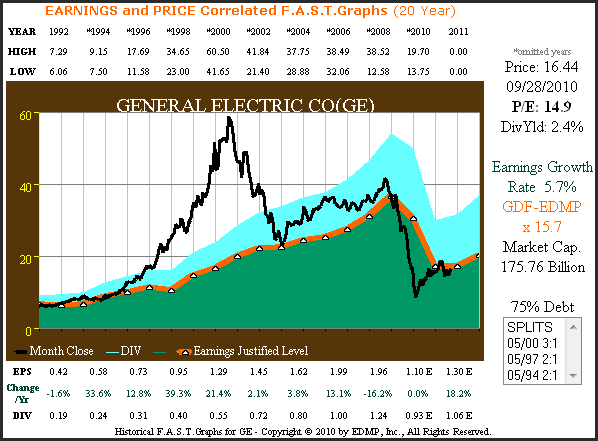
Figures 10A and B look at General Electric Co. (
GE), one of the largest and most diversified industrial companies in the world. Although this large conglomerate is not a pure Aerospace and Defense company, the General Electric airplane engine segment is an important player in Aerospace and Defense. General Electric’s price and earnings correlated graph has many interesting stories to tell. The relationship between earnings and stock price is clear, but not perfect. Even though General Electric’s stock price deviated from the earnings justified value line during the mid-90s irrational exuberant period before peaking in calendar year 2000 they inevitably and swiftly reverted to the mean. Therefore, even though their short-term price deviated from earnings, the long-term earnings price relationship is intact. Also, thanks to a large financial services segment the earnings collapse in 2008 in 2009 led to a justified drop in stock price during this time. With a current yield of 2.4% and a price earnings ratio of 14.9, General Electric appears to be reasonably priced as a turnaround story.
Figure 10A 20yr. EPS Growth Correlated to Price GE
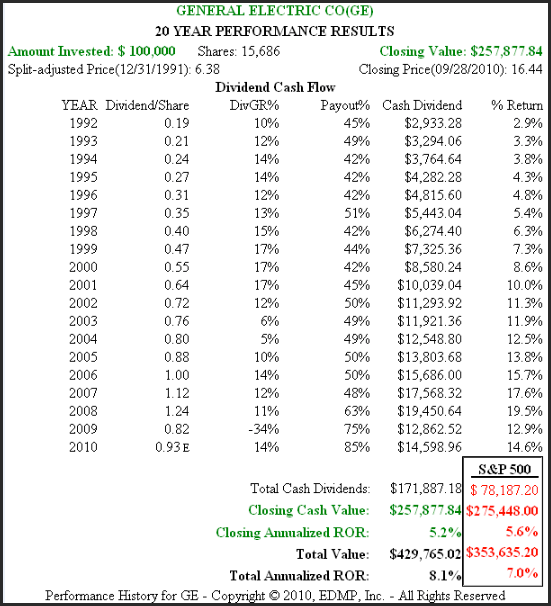
Figure 10B calculates the performance associated with Figure 10A. At the end of the day, General Electric shareholders were rewarded consistent with their long-term earnings growth rate. As earnings faltered in 2008 – 2009, General Electric Co. was forced to cut their dividend in 2009 for the first time in a long time. Once again, a testament to the importance of earnings to shareholders returns and to dividend income.
Figure 10B 20yr. Performance History GE
Summarizing the Five Consistent Growers
When you compare the shareholder returns produced by these five consistent growers, to their more cyclical cousins, the importance of individual business results become evident. Most interesting are the effects that earnings records have on dividends. Consistent and reliable earnings performance is an extremely important consideration for those who are investing for and relying upon dividends for income.
The State of the Aerospace and Defense Industry
On July 28, 2010, Zacks Equity Research produced an interesting report on the outlook for the aerospace and defense industry, below are some interesting tidbits gleaned from their review:
“ ..defense spending is the major source of revenue for the top nine global aerospace companies, of which six are based in the US.”
“The commercial aerospace market, which plummeted during the economic recession, is expected to revive in the coming years, fueled by the gradual recovery of the global economy.”
“Lockheed Martin Corp. is the biggest recipient of US defense contracts followed by the Boeing Company and Northrop Grumman Corp.”
“At the macro level, a gradual shift in defense spending patterns can be discerned. In response to the asymmetric terrorist threats, the emphasis appears to have shifted to high-tech intelligence equipment, replacing demand for conventional big guns and heavy armor.”
“The long-delayed $35 billion contract from the U.S. Air Force for aerial tankers remains a major hope for the defense industry. Boeing and Airbus are two major contenders for the contract and a decision from the department is expected later this year.”
“Outside of defense, the return of demand in commercial airlines remains a positive for the industry,…. Boeing has secured a big order from air China for jetliners.”
Under “weakness” Zacks reported:
“The US Defense Department is planning to reduce the defense budget by $100 billion over the next five years. These cutbacks will impact the big contractors as the lion share of their revenues comes from defense spending.”
Under “prospects” Zacks reported:
“The growing international markets in the Middle East, China, India and South America provide an opportunity for defense operators to increase their revenues. Defense expenditure is increasing gradually in India.”
“The improvement in the economy is gradually feeding the commercial aerospace market. The passenger as well as cargo traffic is expected increase mid-single -digits on an annual basis from now through 2009 in a recent report published by Boeing. The report suggested that the total demand for jets is expected to be 30,900 between 2010 and 2029 amounting to $3.6 trillion.”
Conclusions
Although the aerospace and defense industry is clearly facing some strong headwinds, there are some lights at the end of various tunnels. As can be seen from the earnings correlated graphs above, many of the leading players in this important industry are trading at historically low valuations. In the short run, today’s low valuations may be justified. However, for those willing to take a longer view, today’s low valuations may represent an excellent opportunity to build long-term positions in select companies in this vital industry.
Additionally, for those who are willing to engage in speculative activities, this industry may be of some appeal to them as well. With valuations low on many of these companies, the potential for merger and acquisition activity is high. In the short run, potentially profitable bolt on acquisitions may represent the only short-term avenue for growth available, especially for the bigger players. We believe that the most likely prospects to be acquired are those companies whose businesses are comprised of high-tech intelligence, surveillance, reconnaissance systems and strategic platforms etc.
As always, comprehensive and thorough research and analysis is recommended. We hope this series has provided a good starting point and foundation to assist interested investors. A careful review of the price and earnings correlated graphs presented in this article is offered as a good place to begin.
The opinions in this document are for informational and educational purposes only and should not be construed as a recommendation to buy or sell the stocks mentioned or to solicit transactions or clients. Past performance of the companies discussed may not continue and the companies may not achieve the earnings growth as predicted. The information in this document is believed to be accurate, but under no circumstances should a person act upon the information contained within. We do not recommend that anyone act upon any investment information without first consulting an investment advisor as to the suitability of such investments for his specific situation.


