When I first entered the investment business, a mentor taught me that there were really only two ways that an investor could position their portfolios; they could either act as owners or they could act as loaners. Owners typically invested in equities and were therefore owners of the underlying asset class they invested in. Loaners, on the other hand, invested in debt obligations, essentially loaning their money for interest payments.
As an owner (equity investor), you participate directly in the gains or losses of the underlying asset. Equity investors are therefore placing their capital at risk receiving no guarantees regarding income or profit. In theory, equity investing offers the opportunity for higher returns than fixed income does. On the other hand, equities typically provide the investor a lower cash yield than fixed income does.
Therefore, the main attraction of positioning yourself as a loaner was because you received a fixed interest payment, which typically provided income greater than you could receive from a equity. Since you’re technically loaning your money, not investing it, you also receive the promise of having your capital returned at maturity.
In theory, at least, equity investors sought capital gains and debt investors sought income and safety. As a loaner you’re pretty much limited to a fixed income stream from the interest your loan was obligated to pay you.
As an owner, you could get both; income from dividends and growth from appreciation. These typical characteristics of debt instruments versus equity instruments pretty much held true until 1960 when Congress passed legislation allowing for the formation of real estate investment trusts or REITs.
Prior to REITs, ownership oriented investors only had choices depending on the amount of capital they had available for investment. If they had enough capital they could buy or start their own business or purchase income producing rental properties such as homes, apartment buildings, retail space and even offices. Those with less capital resources to invest were limited to acting as minority shareholders.
Investments in businesses, even very large businesses, through direct stock ownership on a stock exchange or through mutual funds were equally available to anyone with even modest sums to invest. However, direct participation in large-scale income producing real estate was out of reach for most individual investors.
The creation of REITs changed the investing landscape for equity investors. Equity oriented investors now had an income producing equity vehicle that produced yields competitive to and in many cases greater than fixed income offered, without giving up the potential for capital gains.
For a company to obtain their tax-free status as a real estate investment trust [REIT] the entity must possess two main characteristics. First, it must hold more than 75% of their investments in real estate related assets. Second, they are required to pay out 90% of their taxable earnings as dividends to shareholders. Therefore, most equity REITs own and manage real estate investments and generate their income by collecting rents.
Although there are many types of REITs, they are generally classified as equity, mortgage, or hybrids. The following graph from the National Association of Real Estate Investment Trusts [NAREIT], illustrates the diverse nature of REITs:
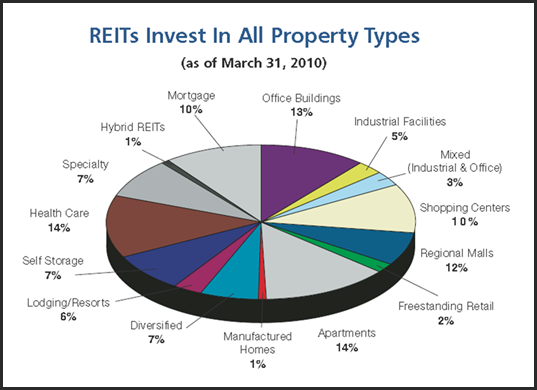
The birth of real estate investment trusts, or REITs, created a hybrid security that many felt offered the best of both debt and equity instruments. By law, a REIT must distribute 90% of its taxable income to shareholders in the form of dividends. REIT dividends have been reasonably steady and reliable, since for most REITs, their income is derived from rents paid by tenants who sign long-term leases on commercial property or from interest payments from financing commercial properties.
Furthermore, because of their unique structure, REIT yields have historically been higher on average than most equities. Consequently, the typical REIT provides their investors a steady stream of income much like a bond, but with the added opportunity for capital appreciation.
According to the National Association of Real Estate Investment Trusts [NAREIT], since 1972, approximately 1/3 of the total return from REIT stocks has come from capital appreciation in share prices. The rest of course, came from dividends distributed.
10 Diversified REITs with Yields Above 5%
We are going to look at 10 diverse real estate investment trusts through the lens of our EDMP, Inc. F.A.S.T. Graphs™. In compiling this list, we screened for REITs with conservative capital structures, debt to equity ratios had to be under 60%. Also, we sought dividend yields of 4% or greater in order to find REITs with an income component that was competitive to fixed income (30 year treasury bonds).
Although our “fundamentals at a glance” research tool was originally designed to correlate operating earnings and stock prices, this doesn’t really apply to REITs. Instead, real estate investment trusts are really a cash flow story. Cash flows associated with REITs are referred to as funds from operations, or FFO.
Unfortunately, our data provider does not provide a mnemonic for FFO. However, since REITs are required to pay 90% of their cash flow to shareholders as dividends, they represent a good proxy. Therefore, we will provide a cash flow multiplier to dividend distributions utilizing the same formulas we would typically apply to earnings-per-share on a traditional company. Then we will produce F.A.S.T. Graphs™ on each REIT covered correlating stock prices to our dividend multiplier.
We believe the reader will find this correlation to be very relevant for determining the True Worth™ value of each REIT that we graph. As each F.A.S.T. Graph™ is reviewed, the relationship between stock prices and dividend distributions will be vividly revealed.
The gray line at the top of the light blue shaded area representing dividends is offered as a dividend income justified valuation measurement. Very simply stated, if the black price line touches the dividend income justified value the REIT is theoretically fairly priced, if below it’s underpriced, and if above it’s overpriced.
In addition to the dividends correlated to stock price F.A.S.T. Graph™ we will also provide a historical performance graph. Therefore, in lieu of generalities, each REIT can be specifically evaluated based on both its income generation and its capital appreciation component. Most importantly, REITs have enjoyed a reputation of reliability due to their asset base being tied to real estate. Therefore, the recent crisis in real estate and its effect on REITs can also be evaluated.
A description of each REIT will be provided directly from their respective websites. Additionally, brief commentary on each F.A.S.T. Graph™ will also be provided. Please note that the purpose of this review is to provide the reader a brief introduction on the various types of REITs that are generally available for investment. No specific buy or sell recommendation is being made, that’s left up to the reader to determine on their own. As always, a more comprehensive research effort is encouraged and recommended.
HCP
“HCP (HCP) invests primarily in real estate serving the healthcare industry in the United States. We are a self-administered real estate investment trust, headquartered in Long Beach, California, with offices in Nashville and San Francisco. We acquire, develop, lease, sell and manage healthcare real estate and provide mortgage and other financing to healthcare providers. Our portfolio includes investments in the following five healthcare segments: (i) senior housing, (ii) life science, (iii) medical office, (iv) hospital, and (v) skilled nursing.”
F.A.S.T. Graphs™ Comments:
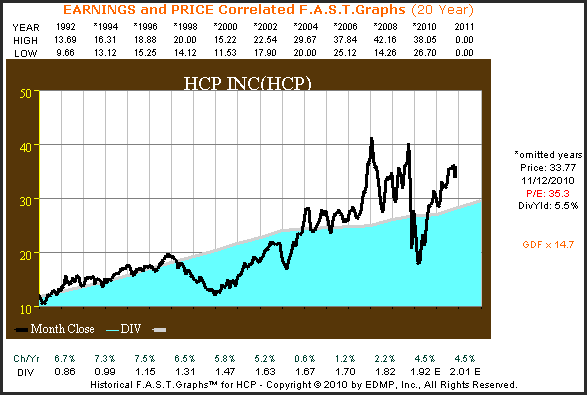
The dividend and price correlated F.A.S.T. Graph™ on HCP below clearly illustrates the importance of REIT dividend distributions to stock price valuation.When the monthly closing stock price line (black line) fell below the dividend justified valuation, HCP was clearly on sale.When the price is above the monthly closing stock price line, like it is today, overvaluation indicates a dangerous time to invest.
Also, historically a normal dividend yield for HCP would average 7% to 10%. Therefore, today’s 5.5% entry yield would indicate modest overvaluation. The consistent dividend growth for this healthcare oriented REIT makes it an attractive candidate, if they could be purchased at a sound valuation.
HCP 20yr. Earnings & Price Correlated F.A.S.T. Graph™
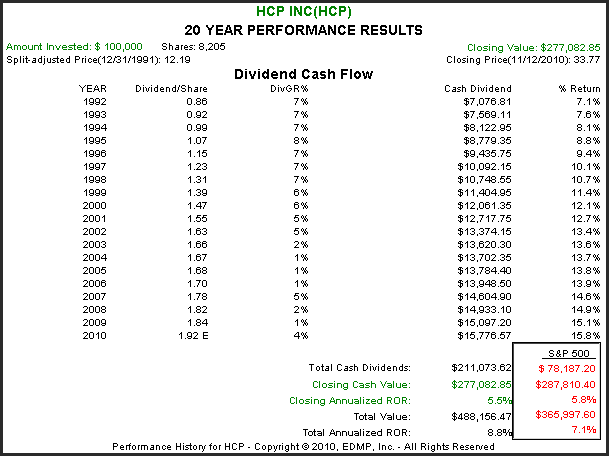
HCP 20yr. Performance Results
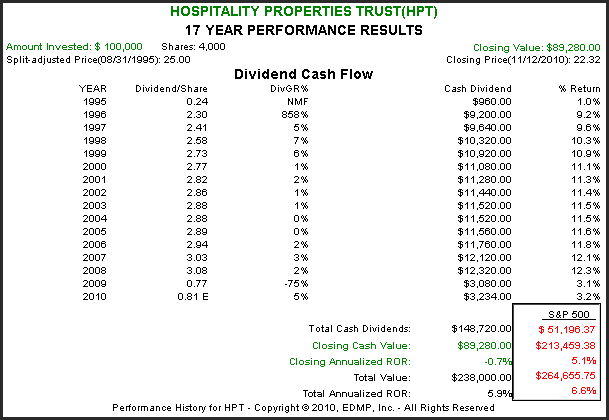
HPT
“Hospitality Properties Trust (HPT) is a real estate investment trust, or REIT, which owns 289 hotels and 185 travel centers located throughout the United States, Ontario, Canada and Puerto Rico. We do not operate hotels or travel centers. Instead, all of our properties are operated by unaffiliated hospitality management companies as part of 13 combination management or lease agreements.”
F.A.S.T. Graphs™ Comments:
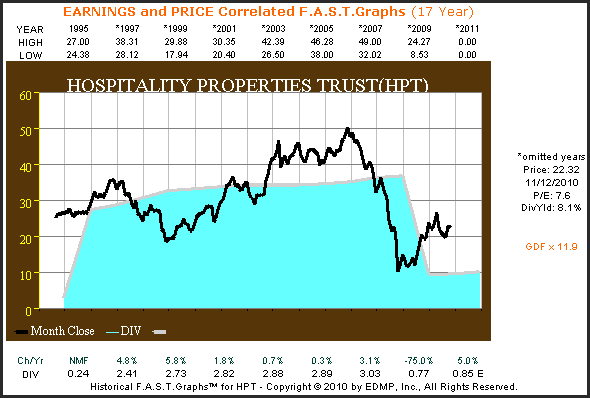
The F.A.S.T. Graphs™ for Hospitality Properties Trust [HPT] illustrates the economic sensitivity of the hotel and travel industry. However, assuming that the hospitality industry recovers, the 8% current yield may compensate for risk. The balance sheet is in decent shape and the debt to equity is a modest 40%. Everything depends on the economic recovery for this REIT.
HPT 17yr. Earnings & Price Correlated F.A.S.T. Graph™
HPT 17yr. Performance Results
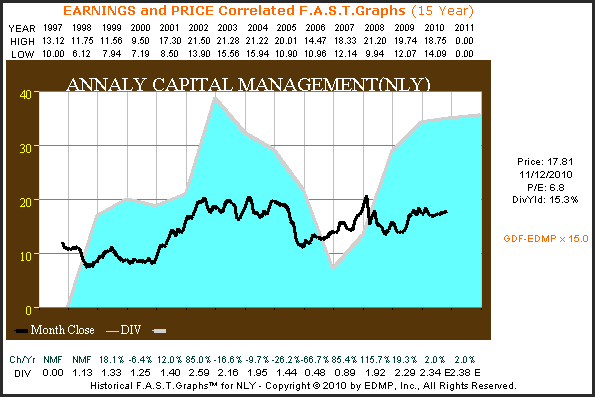
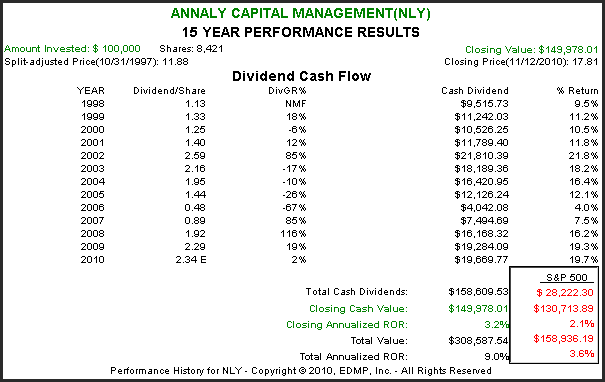
Annaly
“Annaly, Inc. (NLY) commenced operations on February 18, 1997, as a self-managed self-advised company. We have elected to be treated as a real estate investment trust [REIT] under the Internal Revenue Code. We own and manage a portfolio of mortgage-backed securities. Our principal business objective is to generate income for distribution to our stockholders from the spread between the interest income on our mortgage-backed securities and costs of borrowing to finance our acquisition of mortgage-backed securities, and from dividends we receive from our subsidiaries. We trade on the New York Stock Exchange under the symbol NLY.”
F.A.S.T. Graphs™ Comments:
Annaly Capital Management is a mortgage REIT that offers an extremely high current yield. However, as you can see from the following F.A.S.T. Graphs™ their yield can be very volatile. As a mortgage REIT, Annaly Capital makes its money on the spread between their cost of money and the rates on the mortgage-backed securities they purchase. Rising interest rates could be a major risk here, although that may not happen anytime soon. Nevertheless, prospective investors should be aware of this risk.
NLY 15yr. Earnings & Price Correlated F.A.S.T. Graph™
NLY 15yr. Performance Results
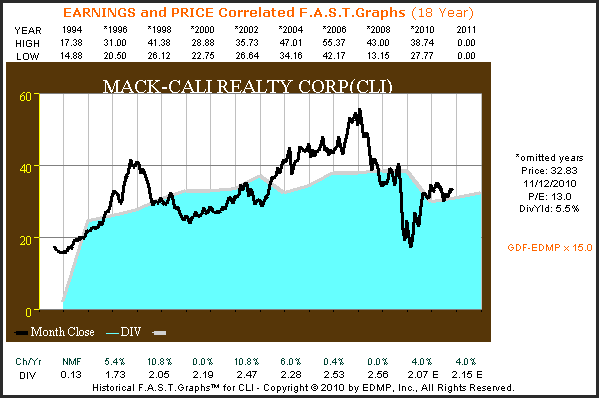
Mack-Cali Realty Corporation
“Among the country’s largest real estate investment trusts (REITs), Mack-Cali Realty Corporation (CLI) is a leading owner, manager, and developer of class A office properties.
The Company’s property portfolio consists of approximately 32.9 million square feet of primarily office and office/flex buildings in the Northeast and Mid-Atlantic regions, as well as close to 11 million square feet of land to accommodate additional commercial development.
With debt-free ownership of the bulk of its portfolio, Mack-Cali is able to offer a faster and more streamlined leasing process.”
F.A.S.T. Graphs™ Comments:
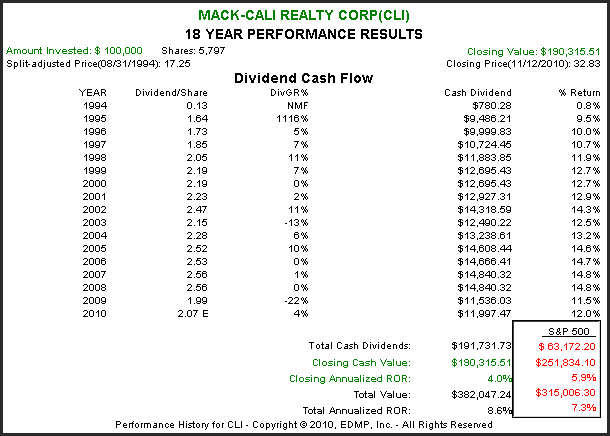
Mack-Cali Realty Corporation (CLI) is an office property oriented REIT that has seen pressure on its funds from operations and subsequently its dividend distributions due to the recent recession. However, they boast of a very strong client list and decent occupancy levels.
All in all, this is a well managed REIT that as the F.A.S.T. Graph™ below indicates maybe attractively valued today. That’s assuming of course that economic recovery occurs. Also, note how quickly their stock price recovered back to their dividend justified value in 2009. (Note that the first year’s dividend growth is misleading due to only a partial distribution in 1994).
CLI 18yr. Earnings & Price Correlated F.A.S.T. Graph™
CLI 18yr. Performance Results
Liberty Property Trust
“Liberty Property Trust (NYSE:LRY) is a $6.4 billion real estate investment trust (as of September 30, 2010) which owns 79.8 million square feet of office and industrial space in over 20 markets throughout the United States and the United Kingdom. Founded in 1972 and headquartered outside Philadelphia, Liberty develops, acquires, leases and manages properties with the mission to enhance people’s lives through extraordinary work environments.”
F.A.S.T. Graphs™ Comments:
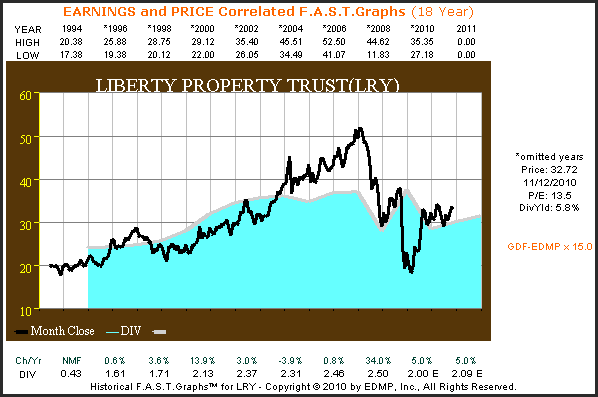
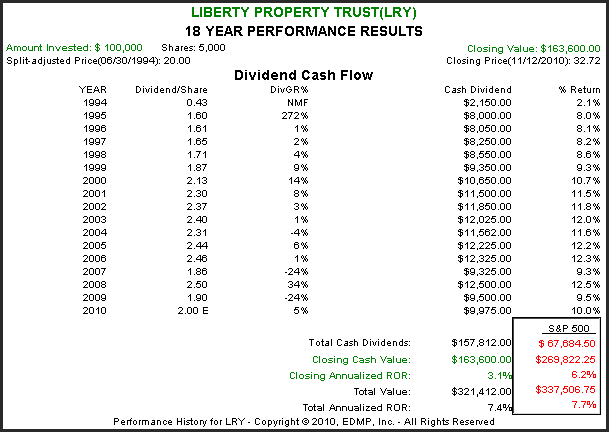
Although Liberty Property Trust (LRY) has a diversified portfolio of business-oriented properties, they have clearly struggled through the recent recession. Their dividend yield of just under 6% is attractive and their finances with a debt to capital ratio of 48% are reasonable. Current valuation on depressed funds from operations appears reasonable.
LRY 18yr. Earnings & Price Correlated F.A.S.T. Graph™
LRY 18yr. Performance Results
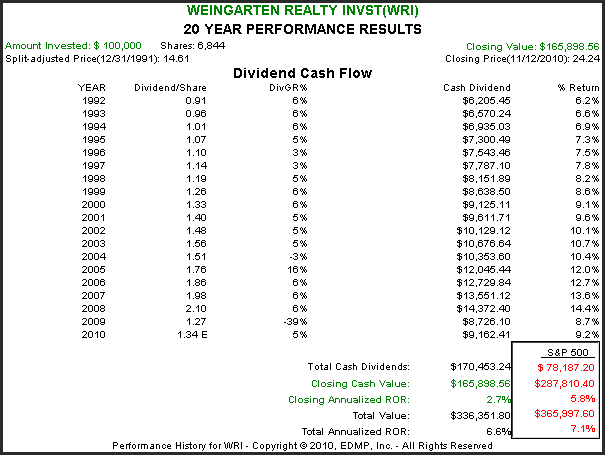
Weingarten
“Weingarten’s (WRI) business activities encompass the long-term ownership, management, acquisition, development and redevelopment of strategically located neighborhood and community shopping centers and select industrial properties. The vast majority of our shopping centers are anchored by either a supermarket or a national value-oriented retailer. These anchors combined with convenient locations, attractive and well-maintained properties and a strong tenant mix help to ensure the long-term success of our merchants and the viability of our portfolio.”
F.A.S.T. Graphs™ Comments:
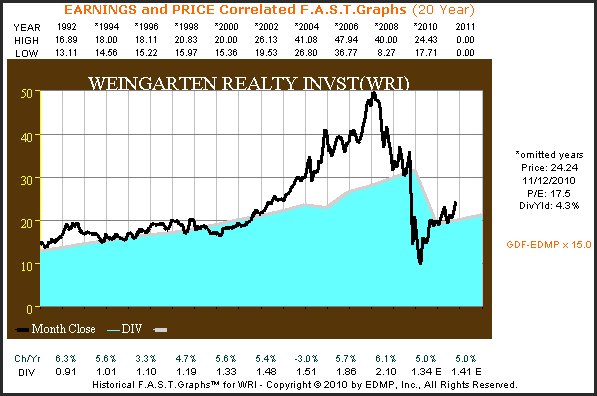
This retail REIT has historically been a very consistent dividend generator with a good record of share price growth until this was all interrupted during the recent recession. Also, as you can see from the price to dividend correlated F.A.S.T. Graph™ below, their stock price was highly inflated from 2001 through 2007. At that time, priced for perfection, shareholders were hit hard by a double whammy. First of all, price reverted to the mean and continued lower as business results faltered. Weingarten Realty is a classic example of the dangers of overvaluation.
WRI 20yr. Earnings & Price Correlated F.A.S.T. Graph™
WRI 20yr. Performance Results
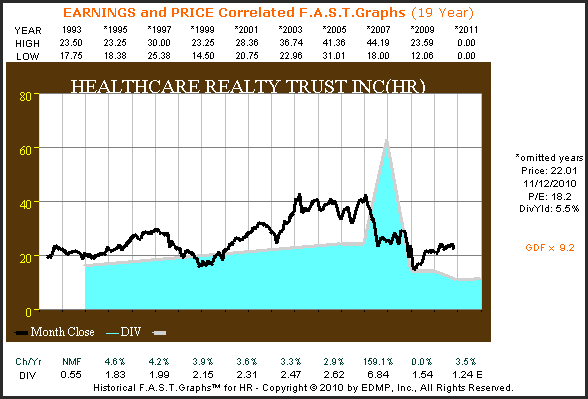
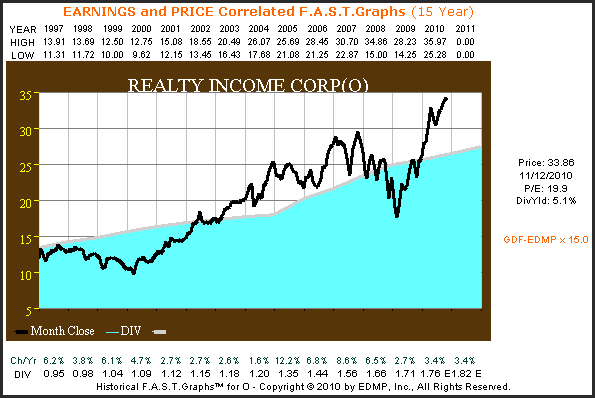
Healthcare Realty Trust
“Listed on the New York Stock Exchange (HR) since 1993, Healthcare Realty Trust (HR) is a real estate investment trust (“REIT”) that integrates owning, managing and developing properties associated with the delivery of healthcare services throughout the United States. The Company maintains a conservative business-risk profile, with a portfolio focused on medical office and outpatient facilities.
F.A.S.T. Graphs™ Comments:
Don’t let the large spike in the dividend distribution on Healthcare Realty Trust fool you. The majority, $4.44 to be exact, was a return of capital. The current dividend estimate for 2010 of $1.20 per share is expected to modestly increase in future years. However, uncertainties relating to future healthcare entitlements are a concern.
HR 19yr. Earnings & Price Correlated F.A.S.T. Graph™
HR 19yr. Performance Results
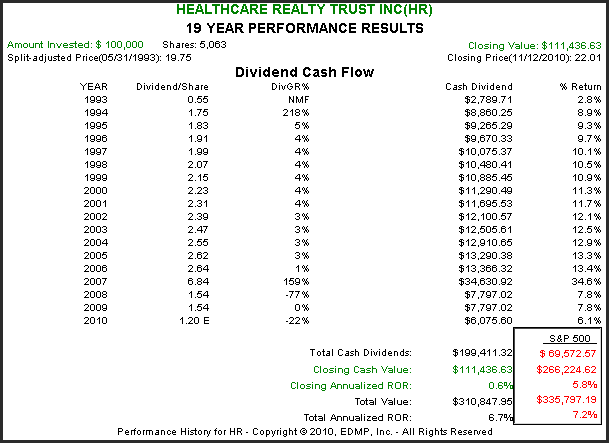
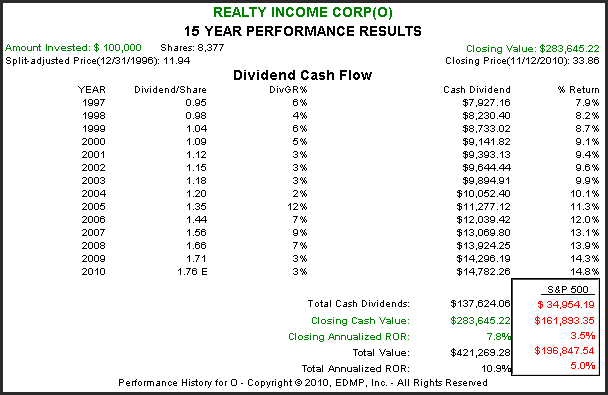
Realty Income Corp
“Realty Income (O) The Monthly Dividend Company® is a real estate company headquartered in Escondido, California. We have a long and distinguished history that goes back to 1969 when we were formed to acquire a very specific type of real estate: freestanding, single-tenant properties leased to retail chains under long-term net-lease agreements. (Retail chains like Taco Bell, Office Max, Children’s World day care, Jiffy Lube, and WaWa Convenience Store.)”
F.A.S.T. Graphs™ Comments:
Realty Income Corp. has one of the most consistent dividend and growth records of any REIT covered in this article.Their tenant base is very stable, and many of their tenants’ businesses are reasonably recession resistant.However, recent rent increases have been hard to come by, which could pressure their ability to continue to raise dividends.
The biggest concern with Realty Income Corp. is currently valuation. The recent run-up in price should be carefully considered even though their 5% dividend yield is attractive for investors seeking income.
O 15yr. Earnings & Price Correlated F.A.S.T. Graph™
O 15yr. Performance Results
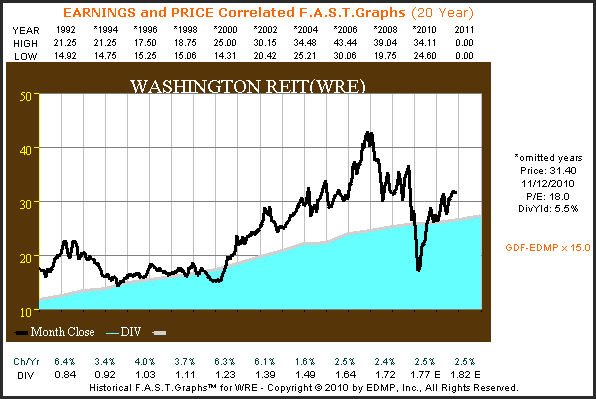
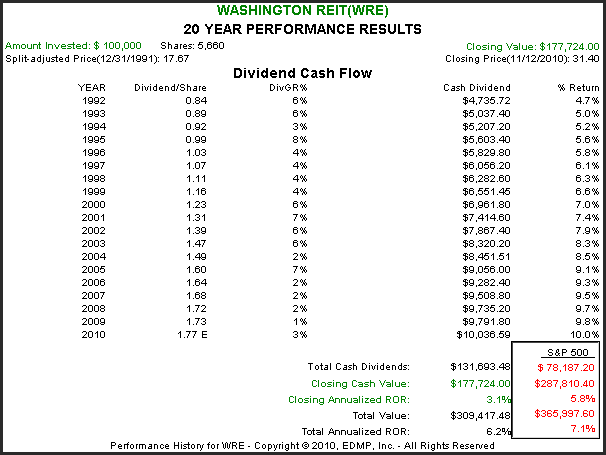
Washington Real Estate Investment Trust
“Washington Real Estate Investment Trust (WRE) is celebrating its 50th year as a self-administered, self-managed, equity real estate investment trust. WRIT owns and operates income-producing real estate properties in the greater Washington, D.C. region. We invest in a diversified portfolio that includes office, industrial/flex, medical office, retail and multifamily properties and land for development. This strategy has proven successful through nearly five decades of established performance in the nation’s capital.”
F.A.S.T. Graphs™ Comments:
The big appeal for Washington Real Estate Investment Trust (WRE) can be found in the old real estate investing adage-location, location, location. With their regional economy based primarily on government and military operations, this REIT has historically produced an excellent record of stable and modestly growing dividend distributions.
Although funds from operations are expected to be modestly lower in 2010, they remain reasonably strong relative to other REITs and appear to be once again stabilizing. Modest overvaluation would be the primary concern here. Also note from the F.A.S.T. Graphs™ the affect that overvaluation in 1992 had on shareholder “Closing Annualized ROR.”
WRE 20yr. Earnings & Price Correlated F.A.S.T. Graph™
WRE 20yr. Performance Results
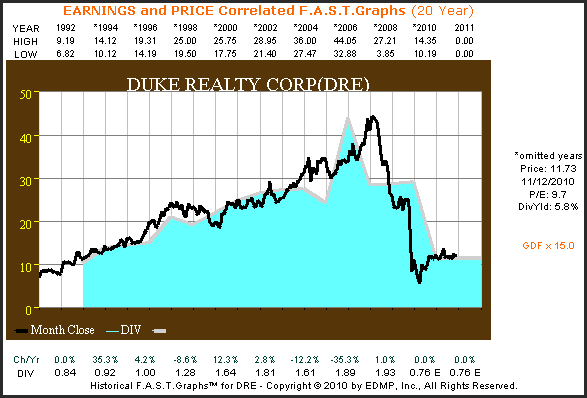
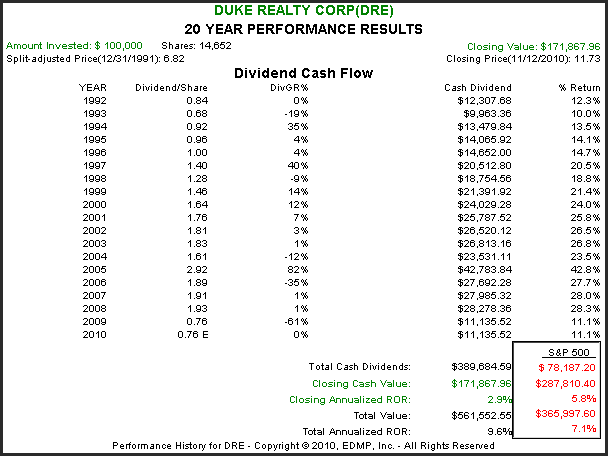
Duke Realty
“Duke Realty (DRE) is one of the largest commercial real estate companies in the United States, with:
- 134 million square feet of industrial, office and medical office properties in 18 major U.S. cities
- Nationwide construction capabilities
- Strategic land positions throughout the United States
- Nearly 1,000 associates providing leasing, property management, site selection, development, financing, and construction services”
F.A.S.T. Graphs™ Comments:
Duke Realty (DRE) is a classic example of how important dividend distributions are to REIT valuations. As funds from operations took a precipitous fall starting in 2008, share prices and dividend distributions followed. Purchases of this REIT would be predicated on a future rebound in construction and construction services.
DRE 20yr. Earnings & Price Correlated F.A.S.T. Graph™
DRE 20yr. Performance Results
Summary and Conclusions
The REIT industry celebrates its 50th year anniversary in 2010. Originally created by an act of Congress and signed into law by Pres. Eisenhower, the REIT industry has grown and evolved. The Industry magazine, Real Estate Investment Today, or REIT, just published their November/December anniversary issue. We would recommend that anyone interested in investing in REITs get their hands on this issue. On page 6, Bryce Blair, chairman and CEO of AvalonBay Communities and current chairman of NAREIT authored an interesting article on the evolution of the REIT industry. Several milestones for the REIT were listed as follows:
- 1972 the first U.S. REIT market benchmark the FTSE NAREIT U.S. Real Estate Index Series was established
- 1986 the Tax Reform Act empowered REITS to operate as bona fide Incorporated companies
- 2010 the REIT industry boasts a market cap of over $330 billion comprised of 149 companies operating in all aspects of the real estate sector.
In contrast to other hybrid securities such as MLPs or Royalty Trusts, the REIT operates as a bona fide Corporation with a CEO and a complete management team and business plan. However, they do possess a unique tax structure that provides them the benefit of not being taxed at the corporate level.
Instead, investors are taxed at their individual tax rates for the ordinary income portion of the dividends they receive from REITs. Return of capital distributions will reduce the investor’s tax basis and eventually be taxed as capital gains when shares are sold. Therefore, it is recommended that investors seek the counsel of their tax advisors before investing in REITs.
The 10 REITs covered in this article were chosen because they offer dividend yields that are currently higher than available in fixed income.However, it should be noted that it was not uncommon to find double-digit dividend yields on many types of REITs throughout the 70s, 80s and 90s.
Therefore, yields of 4.5% to 6% as found on most of the REITs covered in this article are low relative to historical standards. This could imply several things; to include overvaluation, weakening business prospects or a combination of both. Of course, current low interest rates also have an effect.
Finally, a thorough analysis and research effort is highly recommended before investing in REITs.The 10 REITs covered in this article were offered to provide a good cross-section of some of the highest yielding REITs available today across various sectors.By looking at these companies through the lens of our F.A.S.T. Graphs™ research tool we hoped to provide investors a clearer perspective of what they can expect from investments in REITs.
The opinions in this document are for informational and educational purposes only and should not be construed as a recommendation to buy or sell the stocks mentioned or to solicit transactions or clients. Past performance of the companies discussed may not continue and the companies may not achieve the earnings growth as predicted. The information in this document is believed to be accurate, but under no circumstances should a person act upon the information contained within. We do not recommend that anyone act upon any investment information without first consulting an investment advisor as to the suitability of such investments for his specific situation.