If an investor is going to successfully invest in common stocks over their lifetime, there are three important questions that must be correctly answered. What to invest in? When to invest? When to sell? The first question deals with finding the right company or companies that you believe can deliver the returns you are seeking. Of course, this is a multifaceted question that also relates to, and deals with the individual investor’s specific goals, risk tolerances and objectives, in addition to the prospects of the company in question.
For example, whether the company pays a dividend or not may be a prime consideration for certain investors seeking income. On the other hand, the investor looking for maximum growth may not be interested in dividends. Obviously, this first question can be properly answered in a variety of ways that fit one individual investor’s needs and not another’s. Nevertheless, it’s a very important question relative to the type of long-term returns desired. However, we will leave answering this question to other articles. This series of articles will deal with calculating intrinsic value.
The remaining two questions deal with calculating valuation correctly. Since this is the primary purpose of this article, we will add that it is also the contention of this article, that the principles behind valuation are universal. No matter what the investor’s goals are, or whether or not a company pays a dividend, sound valuation should be adhered to. Consequently, the answers to when to invest and conversely when to sell, are rather straightforward. Only invest when sound valuation is present. The concept; sound valuation, is referred to under many different names. Some call it intrinsic value, others call it fair value and we refer to it as True Worth™. However, all of these handles relate to a price that makes prudent and intelligent business sense.
Benjamin Graham the Acknowledged Father of Value Investing
Ben Graham is credited with coining the phrase “intrinsic value”. And as most investors know, his book Security Analysis co-authored with David Dodd and first published in 1934 represents the Bible of value investing even to this day. Ben Graham introduced the principles of valuation to the investing world and established its importance regarding prudent investing practices. In this same vein, we believe that one of Ben Graham’s most important contributions was in drawing a fundamental distinction between investing and speculating. Ben believed that a sound business purchased only at intrinsic value or below provided not only an adequate return, but also a margin of safety.
We believe that another one of Ben Graham’s greatest contributions was providing us his famous formula for valuing a stock. However, before we delve deeply into this formula, some historical perspectives regarding Ben Graham’s world are in order. Ben Graham was born in 1894 and died in 1976. Ben first came to Wall Street and entered the investing world in 1914. Therefore, his formative years were most definitely influenced by the time known as the Industrial Revolution. The following excerpts from Wikipedia discussing the Industrial Revolution provide insight into what was happening to the world of business as Ben Graham was growing up and as he entered young adulthood.
The Industrial Revolution was a period from the 18th to the 19th century where major changes in agriculture, manufacturing, mining, transportation, and technology had a profound effect on the socioeconomic and cultural conditions of the times.”
“Starting in the later part of the 18th century, there began a transition in parts of Great Britain’s previously manual labour and draft-animal–based economy towards machine-based manufacturing. It started with the mechanization of the textile industries, the development of iron- making techniques and the increased use of refined coal. Trade expansion was enabled by the introduction of canals, improved roads and railways.
“The introduction of steam power fuelled primarily by coal, wider utilization of water wheels and powered machinery (mainly in textile manufacturing) underpinned the dramatic increases in production capacity. The development of all-metal machine tools in the first two decades of the 19th century facilitated the manufacture of more production machines for manufacturing in other industries. The effects spread throughout Western Europe and North America during the 19th century, eventually affecting most of the world, a process that continues as industrialization. The impact of this change on society was enormous.
Ben Graham’s Value Formula: V* = EPS x (8.5 + 2g)
The influences of the Industrial Revolution on Ben Graham’s thinking provide both insights and perspectives on the veracity and validity of his famous formula for valuing a stock. Ben Graham was developing his understanding of stock investing during a time when most public companies were agricultural or industrial in nature, and therefore grew very slowly, usually between 0 to 5% per annum. Consequently, his formula for calculating the value of a stock by taking the company’s last 12 months earnings-per-share times the answer of the equation 2 times expected earnings growth plus 8.5 made perfect sense for valuing companies in his era.
In 1974, in an updated version of Security Analysis, Ben Graham’s formula was modified, allegedly to consider and to adapt to changes in prevailing interest rates. Nevertheless, in this part one of our primer on valuation, we intend to offer extensive research-based evidence that validates Ben Graham’s original formula as it applies to companies growing earnings at 5% or less. But more importantly, we intend to offer mathematically-based business and economic principles that illustrate why Ben’s formula makes economic sense for slow-growing companies.
Remember, Ben was creating this formula during a time when companies grew slowly. In parts two and three of this primer on valuation series, we will introduce additional formulas that calculate True Worth™ valuation (what Ben Graham called intrinsic value) on companies with moderate earnings growth, followed by one on companies possessing fast earnings growth. Because we believe that these formulas make economic sense, we also believe that Ben Graham would have logically developed similar formulas that apply to more modern faster growing enterprises.
Keep in mind, that In Ben Graham’s day, there were no Microsoft’s (MSFT), Starbucks (SBUX), Google’s (GOOG), Netflix (NFLX), Apple computers (AAPL) or Green Mountain Coffee Roasters (GMCR), etc. Consequently, it is inconceivable to us that Ben Graham would have suggested multiplying Netflix’s historical 58% earnings growth rate, or its 35% consensus forecast earnings growth rate, times two and adding 8.5 to this number in order to calculate a PE ratio that reflected Netflix’s intrinsic value. Ben Graham never saw companies growing earnings-per-share at such incredible rates. Nevertheless, his original formula stands the test of time today for companies growing at rates that prevailed during his era.
Modern Evidence of Ben Graham’s Formula
The following examples are offered as clear and undeniable evidence of the validity of Ben Graham’s insightful formula. Utilizing our “fundamentals at a glance” research tool F.A.S.T. Graphs™, we intend to demonstrate how profoundly and accurately Ben Graham’s formula applies to companies growing at 5% or less. We automatically apply this formula to slow growth companies and mark each graph drawn with the orange letters GDF (Graham Dodd Formula).
Allow us to emphasize that there is no other manipulation or adjustments applied to or made on these graphs, except for one. We limit the maximum price earnings ratio to 15. For clarification and example, a company growing at 5% would theoretically command a PE ratio of 18.5 (2×5% growth plus 8.5 equals 18.5). We believe that this is too high a multiple to pay for such low growth. In series 2 of our primer on valuation we will argue and provide logic that indicates that companies growing at 10% per annum will also command a PE ratio of approximately 15, because Ben Graham’s formula would place too high a value on 10% growth.
Although it may be confusing, or difficult to wrap your mind around the idea, that both a 5% grower and a 10% grower will utilize the same price earnings ratio to identify intrinsic value, there is a logical explanation. Buying a company at a sound valuation does not determine the rate of return you can earn. Instead, it means that you are making a sound purchase based on a rationally expected valuation that the marketplace will apply to a legitimate operating enterprise (a company or stock).
The rate of return that an investor should logically expect to receive will be more a function of the rate of change of earnings growth that a given company is capable of generating. The faster the earnings growth rate, the higher your return expectations should be. We intend to demonstrate that when you invest at intrinsic value levels, your long-term rate of return will inevitably be a function of your company’s earnings growth. Stated more directly, if you buy a 5% grower at intrinsic value, your long-term capital appreciation expectation should be 5%. If the company pays a dividend, you can add that to your total return. In contrast, if you buy a 10% grower at intrinsic value, your long-term capital appreciation expectation should be 10%, plus dividends as above.
The point is that intrinsic value will inevitably manifest over time. Therefore, if you adhere to investing under the principles of intrinsic value, you will be making sound and intelligent decisions that provide a margin of safety and compensate you for the risk you take. However, your investment receives its value from the cash flow it produces. The higher the growth rate the more cash flows the company will produce, and the higher the rate of return that can be expected as a result. But perhaps most fundamentally, the reason the same PE ratio applies to various growth rates has to do with minimum values based on yield. With common stocks its earnings yield, however, with bonds there’s a related interest yield.
Bonds Set the Valuation Threshold
Considering that a bond is a fixed income instrument, it provides a yield that doesn’t grow. For example, a 10 year bond that pays 8% interest has a price to interest ratio (PI Ratio) of 12.5 (cost of 100, divided by eight, the interest rate). Or as you would more commonly find today, a 10 year corporate bond paying approximately 5% has a price to interest ratio (PI Ratio) of 20. There are two important points that are being made here. First, even a no growth fixed stream of income has a value that is represented as a multiple of its yield. Second, the lower the yield the higher the price, or the more expensive the fixed income instrument is.
Ben Graham understood that intrinsic value was functionally related to fixed income rates or bond rates, and he wrote about it extensively. Ben understood that stocks and bonds were in competition with each other and therefore simultaneously related. In many letters and papers Ben talked about how stock PE ratios were affected by not only the levels of bond yields, but by their changes as well. The following quotes from Common Sense Investing: The papers of Benjamin Graham written by Benjamin Graham courtesy of Valuehuntr provide a clear example of this point:
It seems logical to me that the earnings/price ratio of stocks generally should bear a relationship to bond interest rates.”
“Viewing the matter from another angle, I should want the Dow or Standard & Poor’s to return an earnings yield of at least four- thirds that on AAA bonds to give them competitive attractiveness with bond investments.
Testing Ben Graham’s Formula in the Real World
Ben Graham’s famous formula for valuing a common stock would just be a theory unless it worked in the real world. Remarkably, we have discovered that Ben Graham’s formula is uncannily accurate towards measuring intrinsic value of companies with earnings growth rates between zero and 5%. When Ben’s formula is applied to companies with these growth rates, we discovered that the historical valuations the market has valued them at correlates almost perfectly. Of course, as we presented above, there are sound economic reasons for this to be true.
Our fundamentals driven research tool was designed to measure intrinsic value based on discounting cash flows, past present or future. Extensive research has led us to utilizing three formulas for determining intrinsic value based on the velocity or rate of change of earnings growth (cash flows). Two of the formulas are widely accepted methods of valuing common stocks. The third formula is a modified version, or extrapolation, between the first two. Of course, the first formula is Ben Graham’s famous formula cited above.
Ben Graham’s formula: Proofs
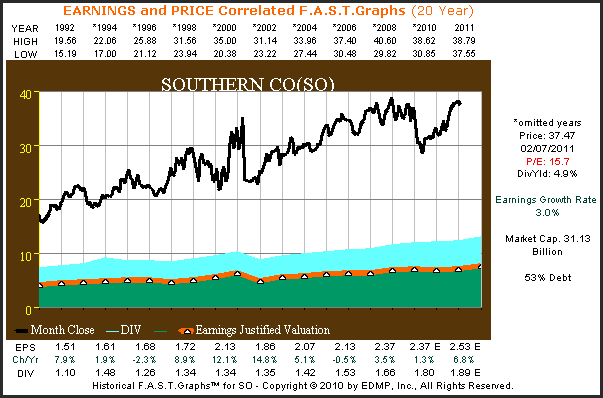
Due to the regulated nature of their businesses, utility stocks are, almost by definition, slow but predictable growers. Therefore, they represent a quintessential example of the kind of company that our research indicates that Ben Graham’s formula applies to. The graph below plots the stock price independent of earnings and dividends of Southern Company (SO), a well-known utility, since 1992. Note that there is no correlation here, the black monthly closing stock price line since 1992 is merely graphed on the same chart as the orange earnings per share line multiplied by the earnings growth rate. The light blue shaded area on top of the orange earnings line represents the dividends paid out of the green earnings shaded area.
When these important datasets are plotted separately like they are below, there is a lot of information offered, but little knowledge that can be applied to valuation. We see that the price has been volatile during each year and we can determine that it has approximately doubled over this 19-plus year time frame. In the same vein, we see that the earnings growth rate of 3.3% translated into earnings going from $1.51 in 1992 to an estimated $2.53 in 2010. Additionally, we see that the dividend has grown from a $1.10 per share in 1992 to a $1.80 per share in 2010. However, what the chart doesn’t tell us is what a fair valuation would be for Southern Company.
Southern Company (SO): Price and Earnings Plotted Separately
(Click charts to expand)
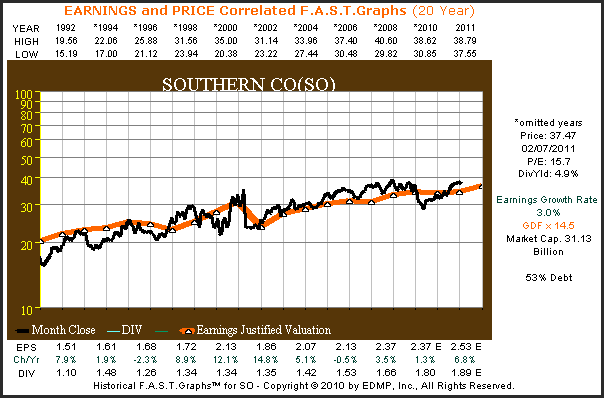
This next graph is drawn logarithmically, and applies Ben Graham’s formula for valuing a company. When Ben Graham’s formula is applied to earnings per share, the orange earnings line becomes the earnings justified valuation line. In this example the orange earnings justified valuation line depicts an intrinsic value PE ratio of 15. The correlation between earnings multiplied by Ben Graham’s formula for valuing a company and its stock price is profound (GDF is Graham Dodd Formula). Clearly from the graph below, anytime the stock price was below the orange line, the stock was a good buy, and when the price was above the orange line the stock was overpriced.
Ben Graham’s Formula: Southern Co. – Price Correlated to Earnings – Logarithmically
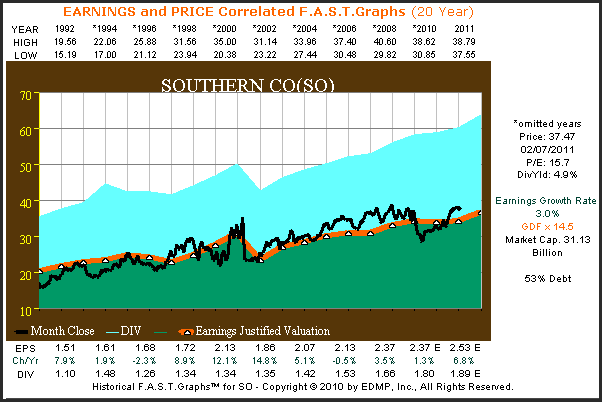
Ben Grahams Formula: Southern Company – Price, Earnings and Dividends
The traditional graph below illustrates how closely stock prices follow earnings under Ben Graham’s famous formula for valuing a business. When the black price line touches the orange line it’s in value, when the black price line is above the orange line the stock is overvalued, and when the black price line is under the orange line the stock is undervalued. In this example, Ben Graham’s formula works extremely well. Note that the stock price was below the orange earnings justified valuation line starting in 1992, indicating undervaluation, and is currently touching the orange earnings justified valuation indicating current fair value.
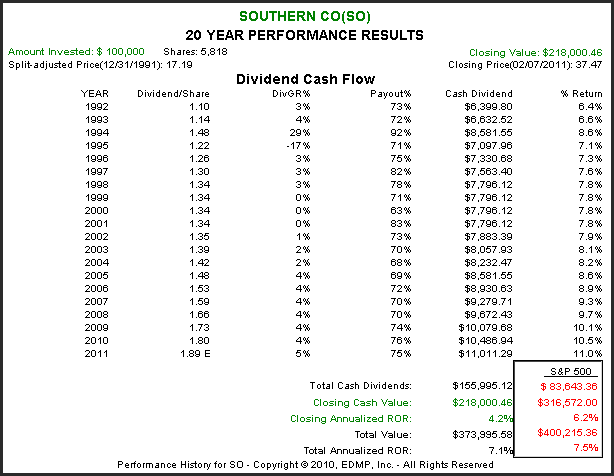
From the calculated performance results associated with the graph above, we discover that Southern Company’s (SO) shareholders closing annualized rate of return correlates very closely to the company’s earnings growth and differs only because of starting undervaluation. This validates the principles that the earnings growth rate will generate long-term shareholder returns, and that the Graham Dodd Formula (GDF) represents sound valuation. From the above graph it is clearly evident that you would never want to pay more than Ben Graham’s formula to buy Southern Company.
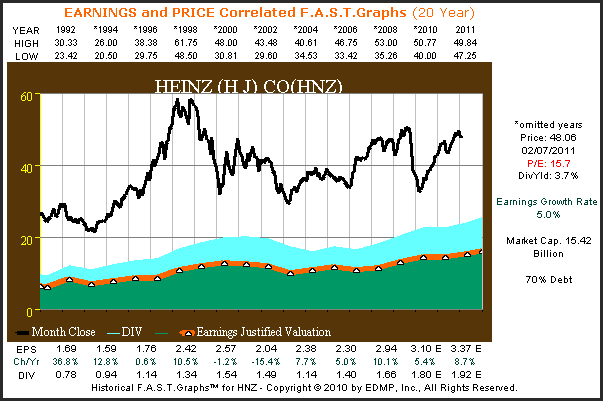
H.J. Heinz Company (HNZ): Price and Earnings Plotted Separately
Next we look at H.J. Heinz & Co. (HNZ), a second example reflective of a company with an earnings growth rate that was typical during Ben Graham’s era. Once again, we find that earnings and stock prices plotted independent of each other provide lots of information, but little perspective on valuation.
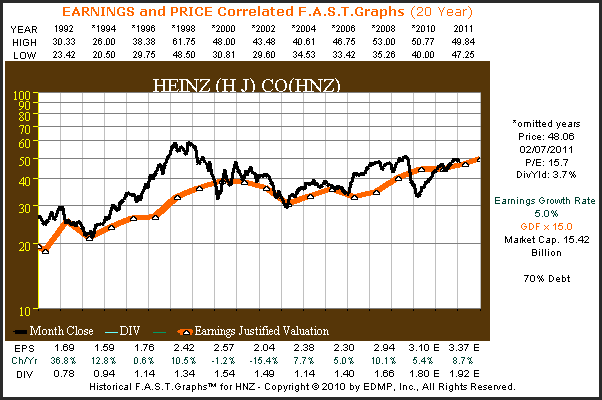
Ben Graham’s Formula: H.J. Heinz Co. – Price Correlated to Earnings – Logarithmically
The logarithmic graph on H.J. Heinz & Co. (HNZ) once again illustrates the validity of Ben Graham’s formula. Although H.J. Heinz achieved an earnings growth rate of 5% since 1992, earnings were much less predictable than we saw with our utility example. Nevertheless, from the graph below it’s clear that you would not want to invest in Heinz when its price was above Ben Graham’s formula for value.
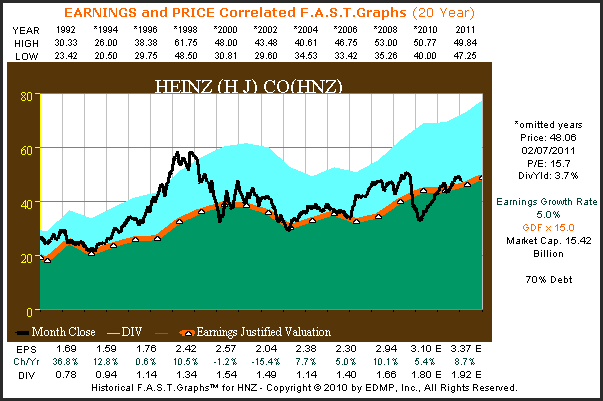
Ben Grahams Formula: H.J. Heinz & Co. – Price, Earnings and Dividends
From the graph below we once again see that in the long run stock price follows and correlates to earnings under Ben Graham’s value formula. In this example we do see periods where the market irrationally priced H.J. Heinz stock, especially during the period 1994 to 1998. However, we also see stock price inevitably return to Ben Graham’s definition of intrinsic value. Conversely, on the few times when the black price line fell below the orange earnings justified valuation line, price also soon moved back up to fair value.
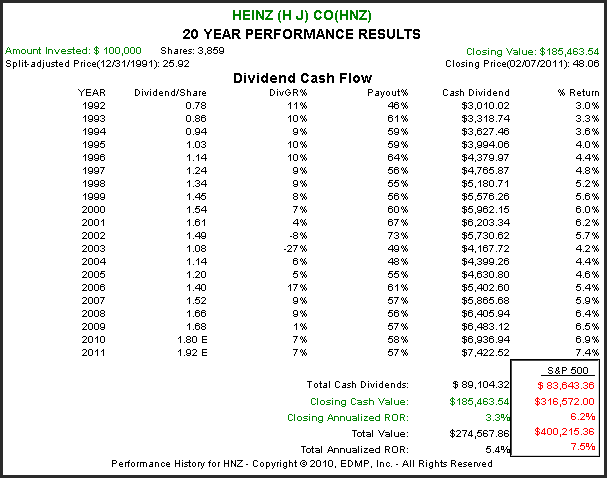
When we examine the performance results associated with the above graphs on H.J. Heinz & Co. we again find the relationship between the earnings growth rate and shareholder returns to be true. In the long run, shareholder returns will be a function of the earnings the company generates adjusted for valuation. Also, it should be clear from the above graph that investing in H.J. Heinz at a price earnings ratio above the one justified by Ben Graham’s formula (the orange line) is a bad idea in the long run.
Summary and Conclusions
Ben Graham’s formula for valuing a company V* = EPS x (8.5 + 2g) established a solid foundation for future value investors to build upon. The small “g” in the formula represents your reasonably expected 7 to 10 year growth rate. Consequently, Ben Graham’s formula was forward-looking. In this article we looked at modern historical performance in order to test the validity of this famous value formula. Remarkably, the formula proves itself to being very precise when applied in the real world to businesses that grow earnings between zero and 5% per annum. Follow this link (Ben Graham’s Famed Formula for Valuing a Stock) to see 10 additional real world examples of Ben Graham’s formula at work.
Ben Graham constantly taught us that the stock market was not always rational. He pointed out that there will be times when the markets would behave very foolishly. However, he also suggested that having an intelligent framework based on valuation would allow investors to avoid making foolish mistakes. Ben Graham immortalized this market reality with his famous allegory courtesy of Wikipedia as follows:
Graham’s favorite allegory is that of Mr. Market, an obliging fellow who turns up every day at the share holder’s door offering to buy or sell his shares at a different price. Often, the price quoted by Mr. Market seems plausible, but sometimes it is ridiculous. The investor is free to either agree with his quoted price and trade with him, or ignore him completely. Mr. Market doesn’t mind this, and will be back the following day to quote another price.
Wikipedia then goes on to explain the relevance of Ben’s famous allegory:
The point of this anecdote is that the investor should not regard the whims of Mr. Market as a determining factor in the value of the shares the investor owns. He should profit from market folly rather than participate in it. The investor is advised to concentrate on the real life performance of his companies and receiving dividends, rather than be too concerned with Mr. Market’s often irrational behaviour.
There are sound business and economic principles behind the concept of valuation. Ben Graham did more than give us a formula for calculating intrinsic value, he taught us that valuation matters a lot. When you pay more than sound valuation indicates, you will be taking more risk for potentially a much lower return than you deserve. Conversely, if you buy at a bargain price, your risk will be lower and your future returns potentially higher.
Disclosure: I am long HNZ.
Disclaimer: The opinions in this document are for informational and educational purposes only and should not be construed as a recommendation to buy or sell the stocks mentioned or to solicit transactions or clients. Past performance of the companies discussed may not continue and the companies may not achieve the earnings growth as predicted. The information in this document is believed to be accurate, but under no circumstances should a person act upon the information contained within. We do not recommend that anyone act upon any investment information without first consulting an investment advisor as to the suitability of such investments for his specific situation.